 Global| Jan 28 2003
Durable Goods Orders Up Slightly
by:Tom Moeller
|in:Economy in Brief
Summary
Durable goods orders rose about as expected last month. The gain was slight and followed a sharp November decline that was little revised. Consensus expectations had been for a 0.5% rise. The rise in durable orders failed to match the [...]
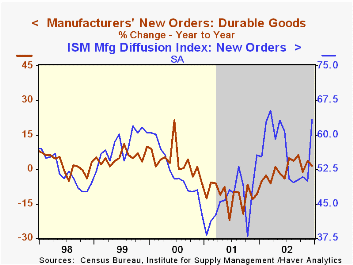
Durable goods orders rose about as expected last month. The gain was slight and followed a sharp November decline that was little revised. Consensus expectations had been for a 0.5% rise.
The rise in durable orders failed to match the sharp improvement in the ISM orders index in December. During the last ten years there has been a 47% correlation between the annual change in orders for durable goods and the level of the ISM orders index.
Orders for motor vehicles and parts fell 4.5% following a 6.1% November swoon. Orders excluding all transportation equipment rose 1.1% (1.8% y/y) but a sharp decline in November was revised deeper to -2.0%.
Orders for nondefense capital goods rose sharply and the steep decline in November was revised quite a bit shallower. The upward revision was due to a raised estimate of commercial aircraft orders. Capital goods orders excluding aircraft and parts orders fell 0.1% (0.2% y/y) following a 3.1% November decline.
Orders for computers and electronic products recouped a sharp November decline (-2.3% y/y). Machinery orders rose slightly after a steep November decline (-0.1% y/y). Orders for electrical equipment rose 1.0% (-0.3% y/y) for the first rise in three months.
Shipments of durable goods fell 1.5% (-0.2% y/y) for the fourth steep decline in the last five months. Falling shipments of motor vehicles has been leading the decline. Shipments excluding all transportation categories fell 0.3% (+1.8% y/y), also down for the fourth month in five.
Durable inventories rose a sharp 0.9% (-3.7% y/y) but the gain was mostly confined to a 6.0% rise in aircraft and parts. Excluding all transportation, inventories fell 0.1% (-4.2% y/y).
| NAICS Classification | Dec | Nov | Y/Y | 2002 | 2001 | 2000 |
|---|---|---|---|---|---|---|
| Durable Goods Orders | 0.2% | -1.3% | 1.7% | -0.1% | -11.4% | 3.3% |
| Nondefense Capital Goods | 2.8% | -1.3% | 1.0% | -5.3% | -16.5% | 7.9% |
by Tom Moeller January 28, 2003
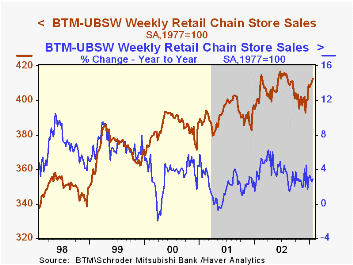
Chain store sales rose for the third consecutive week according to the BTM-UBSW survey.
January sales to date were 2.3% above the December average.
During the last ten years there has been a 56% correlation between the year-to-year percent change in monthly chain store sales and the change in nonauto retail sales less gasoline.
| BTM-UBSW (SA, 1977=100) | 1/25/03 | 1/18/03 | Y/Y | 2002 | 2001 | 2000 |
|---|---|---|---|---|---|---|
| Total Weekly Retail Chain Store Sales | 412.7 | 410.2 | 2.9% | 3.6% | 2.1% | 3.4% |
by Tom Moeller January 28, 2003
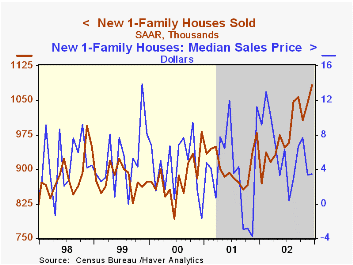
Sales of new single family homes were stronger than expected last month. Sales unexpectedly rose 3.5% from November which was revised down slightly. Consensus expectations were for a 1.030 Mil. sales rate in December.
Sales in December set a new record and for the full year were also a record.
Sales were mixed across the country’s regions. Sales in the Midwest rose 28.3% m/m and 17.8% for the full year. Sales in the South were flat for the second month and up 2.3% for the year. In the Northeast, sales fell 12.7% for the third monthly decline, -1.5% for the full year. In the West, sales fell for the second month but were up 14.6% for the year.
The median price of a new home surged 7.2% to $186,400 and prices for the year were up 6.1%, the strongest rate of gain since 1989.
The new home sales data reflect current sales versus the existing home sale figures which reflect closings on past sales.
| Homes Sales (000s, AR) | Dec | Nov | Y/Y | 2002 | 2001 | 2000 |
|---|---|---|---|---|---|---|
| New Single-Family | 1,082 | 1,045 | 10.5% | 981 | 908 | 880 |
by Tom Moeller January 28, 2003
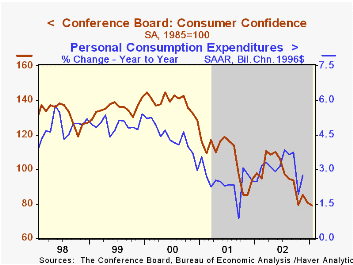
The Conference Board’s Index of Consumer Confidence for January equaled Consensus expectations were for a reading of 79.0. December confidence was revised up slightly
The 2.1% m/m decline pulled Consumer Confidence 45.4% below the peak of early 2000. The decline in Confidence was in line with the January decline Consumer Sentiment from the University of Michigan.
The decline in confidence reflected a lower reading of consumer expectations but a higher read of the present situation reading.
During the last ten years there has been a 50% correlation between the level of Consumer Confidence and the y/y percent change in real PCE. That correlation rose to 74% during the last five years.
The Conference Board's survey is conducted by a mailed questionnaire to 5,000 households and about 3,500 typically respond.
| Conference Board | Jan | Dec | Y/Y | 2002 | 2001 | 2000 |
|---|---|---|---|---|---|---|
| Consumer Confidence | 79.0 | 80.7 | -19.2% | 96.6 | 106.6 | 139.0 |

Tom Moeller
AuthorMore in Author Profile »Prior to joining Haver Analytics in 2000, Mr. Moeller worked as the Economist at Chancellor Capital Management from 1985 to 1999. There, he developed comprehensive economic forecasts and interpreted economic data for equity and fixed income portfolio managers. Also at Chancellor, Mr. Moeller worked as an equity analyst and was responsible for researching and rating companies in the economically sensitive automobile and housing industries for investment in Chancellor’s equity portfolio. Prior to joining Chancellor, Mr. Moeller was an Economist at Citibank from 1979 to 1984. He also analyzed pricing behavior in the metals industry for the Council on Wage and Price Stability in Washington, D.C. In 1999, Mr. Moeller received the award for most accurate forecast from the Forecasters' Club of New York. From 1990 to 1992 he was President of the New York Association for Business Economists. Mr. Moeller earned an M.B.A. in Finance from Fordham University, where he graduated in 1987. He holds a Bachelor of Arts in Economics from George Washington University.
More Economy in Brief


