 Global| Dec 24 2002
Durable Goods Orders Fell Unexpectedly
by:Tom Moeller
|in:Economy in Brief
Summary
Durable goods orders last month fell unexpectedly and the gain in October was revised lower. Consensus expectations had been for a 0.6% rise. Orders for nondefense capital goods fell sharply, reversing most of the sharp October gain [...]
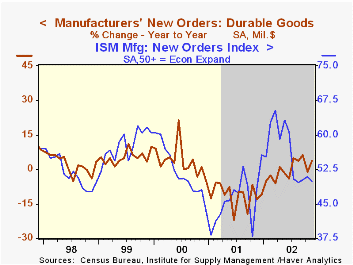
Durable goods orders last month fell unexpectedly and the gain in October was revised lower. Consensus expectations had been for a 0.6% rise.
Orders for nondefense capital goods fell sharply, reversing most of the sharp October gain and leaving in place an erratic sideways movement for most of the year. Capital goods orders excluding aircraft and parts orders also fell, down 2.2% for the third decline in the last four months.
Orders for motor vehicles and parts fell 4.5%, reversing all of the prior month's gain. Orders excluding all transportation equipment fell 1.3% and reversed virtually all of the October rise.
Orders for computers and electronic products added slightly to the strong October gain (-2.9% YTD). Machinery orders plunged 3.2% for the third decline in four months (-0.9% YTD). Orders for electrical equipment fell 0.6% and were down 1.2% YTD.
During the last ten years there has been a 47% correlation between the annual change in orders for durable goods and the level of the ISM orders index.
Shipments of durable goods fell 1.3% (1.8% YTD). Shipments of computers fell 3.2% (+3.6% YTD).
Durable inventories fell 0.2% (-4.6% YTD), the fourteenth consecutive monthly decline.
For new analysis by the NY Federal Reserve on inventory behavior, go to nyfed.org.
| NAICS Classification | Nov | Oct | Y/Y | 2001 | 2000 | 1999 |
|---|---|---|---|---|---|---|
| Durable Goods Orders | -1.4% | 1.7% | 3.6% | -11.4% | 3.3% | 5.4% |
| Nondefense Capital Goods | -3.2% | 4.8% | 0.5% | -16.5% | 7.9% | 3.9% |
by Tom Moeller December 24, 2002
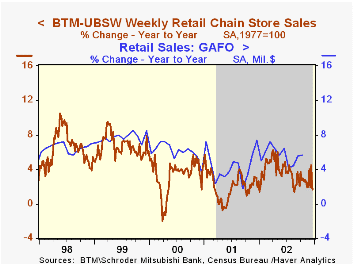
Chain store sales added slightly last week to the 1.9% rise in the week prior according to the BTM-UBSW survey.
December sales so far were 0.6% below the November average.
The BTM Leading Indicator of chain store sales rose slightly following a sharp decline the week prior (-0.2% y/y).
During the last ten years there has been a 48% correlation between the year-to-year percent change in monthly chain store sales and the change in GAF retail sales. That correlation rose to 64% during the last five years.
| BTM-UBSW (SA, 1977=100) | 12/21/02 | 12/14/02 | Y/Y | 2001 | 2000 | 1999 |
|---|---|---|---|---|---|---|
| Total Weekly Retail Chain Store Sales | 400.4 | 400.1 | 1.7% | 2.1% | 3.4% | 6.7% |

Tom Moeller
AuthorMore in Author Profile »Prior to joining Haver Analytics in 2000, Mr. Moeller worked as the Economist at Chancellor Capital Management from 1985 to 1999. There, he developed comprehensive economic forecasts and interpreted economic data for equity and fixed income portfolio managers. Also at Chancellor, Mr. Moeller worked as an equity analyst and was responsible for researching and rating companies in the economically sensitive automobile and housing industries for investment in Chancellor’s equity portfolio. Prior to joining Chancellor, Mr. Moeller was an Economist at Citibank from 1979 to 1984. He also analyzed pricing behavior in the metals industry for the Council on Wage and Price Stability in Washington, D.C. In 1999, Mr. Moeller received the award for most accurate forecast from the Forecasters' Club of New York. From 1990 to 1992 he was President of the New York Association for Business Economists. Mr. Moeller earned an M.B.A. in Finance from Fordham University, where he graduated in 1987. He holds a Bachelor of Arts in Economics from George Washington University.
More Economy in Brief


