 Global| Oct 26 2005
Diversity in Japanese Trade
Summary
The Japanese trade balance continues to diminish, a direct reflection of its need to import nearly all of the petroleum it uses. In September, the surplus was ¥556.5 billion (seasonally adjusted), down from ¥610.6 in August, ¥828.3 [...]
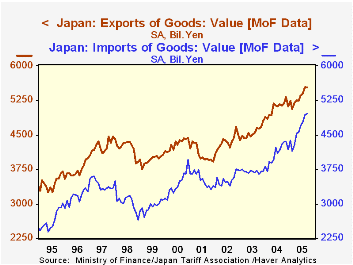
The Japanese trade balance continues to diminish, a direct reflection of its need to import nearly all of the petroleum it uses. In September, the surplus was ¥556.5 billion (seasonally adjusted), down from ¥610.6 in August, ¥828.3 billion in September 2004 and nearly ¥1 trillion on average for all of 2004. This is not the fault of Japan's exports performance. Foreign shipment are expanding nicely; in September they did edge down ¥15 million from ¥5.544 trillion (seasonally adjusted) in August, but that figure was a record, and up more than 9% from a year earlier.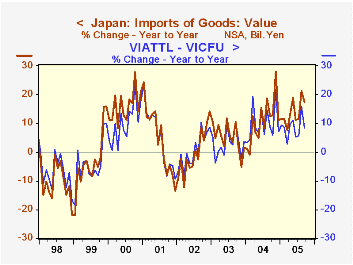
But imports grew faster still. They were ¥4.973 billion in September, up 17.4% from the year-ago month, following year-on-year growth of 21.2% in August. These are not the fastest growth rates for imports ever in Japan, far from it. But they show the sensitivity of Japan's import picture to petroleum. The last time there were sustained increases of this magnitude was the winter of 2000-2001 when petroleum and natural gas prices were accelerating rapidly. Excluding the mineral fuel category, other Japanese imports were up 8.3% in September. Imports from China are an important part of import growth as well; they were up 11.9% on the last 12 months. Chinese goods now hold a 29.5% share of imports excluding mineral fuels compared with 26.5% on average last year and 22.7% as recently as 2002.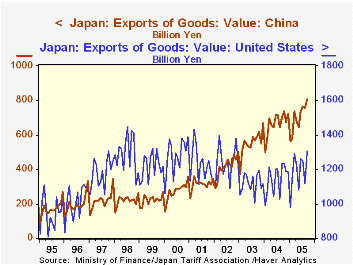
At the same time, China is also a big market for exports of Japanese products. While it is not nearly as large a customer as the US, it seems to be working hard to catch up. As seen in the table below, its share of Japanese exports has increased by 4 percentage points since 2002, while the US share is down about 6-1/2 points. Other nations picking up market share for Japanese goods include India and Eastern Europe. So Japan's trading is clearly widespread and becoming more so all the time. Such diverse export gains can help it pay for the expensive oil it must buy.
| Japan: Bil.¥ NSA except as noted |
Sept 2005 | Aug 2005 | July 2005 | Sept 2004 | Monthly Averages|||
|---|---|---|---|---|---|---|---|
| 2004 | 2003 | 2002 | |||||
| Trade Balance (SA) | 556.5 | 610.6 | 604.3 | 828.3 | 996.5 | 843.9 | 823.2 |
| Exports | 5925.3 | 5220.6 | 5536.9 | 5445.8 | 5097.5 | 4545.7 | 4342.4 |
| To US % of Total | 22.0 | 21.3 | 22.6 | 22.7 | 22.4 | 24.6 | 28.5 |
| To China % of Total | 13.6 | 14.5 | 13.8 | 12.9 | 13.1 | 12.2 | 9.6 |
| Sum | 35.6 | 35.8 | 36.4 | 35.6 | 35.5 | 36.8 | 38.1 |
| Imports | 4968.3 | 5106.8 | 4668.1 | 4232.6 | 4101.4 | 3696.8 | 3519.0 |
| Ex Mineral Fuels | 3575.0 | 3722.1 | 3469.6 | 3300.1 | 3212.2 | 2917.7 | 2837.8 |
| China % of Total | 21.3 | 20.5 | 20.3 | 22.3 | 20.7 | 19.7 | 18.3 |
| China % of Non- Min Fuel | 29.5 | 28.1 | 27.3 | 28.6 | 26.5 | 24.9 | 22.7 |
Carol Stone, CBE
AuthorMore in Author Profile »Carol Stone, CBE came to Haver Analytics in 2003 following more than 35 years as a financial market economist at major Wall Street financial institutions, most especially Merrill Lynch and Nomura Securities. She had broad experience in analysis and forecasting of flow-of-funds accounts, the federal budget and Federal Reserve operations. At Nomura Securities, among other duties, she developed various indicator forecasting tools and edited a daily global publication produced in London and New York for readers in Tokyo. At Haver Analytics, Carol was a member of the Research Department, aiding database managers with research and documentation efforts, as well as posting commentary on select economic reports. In addition, she conducted Ways-of-the-World, a blog on economic issues for an Episcopal-Church-affiliated website, The Geranium Farm. During her career, Carol served as an officer of the Money Marketeers and the Downtown Economists Club. She had a PhD from NYU's Stern School of Business. She lived in Brooklyn, New York, and had a weekend home on Long Island.
More Economy in Brief


