 Global| Oct 07 2005
Decline in U.S. Payrolls Dampened
by:Tom Moeller
|in:Economy in Brief
Summary
Non-farm payrolls declined 35,000 in September. The decline very much reflected the effects of Hurricane Katrina, then Hurricane Rita which made landfall during the week the employment surveys were taken. The m/m decline in payrolls [...]
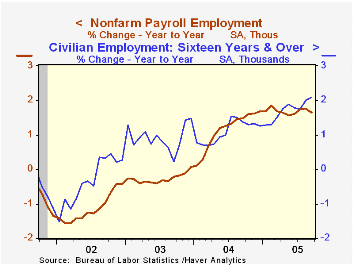
Non-farm payrolls declined 35,000 in September. The decline very much reflected the effects of Hurricane Katrina, then Hurricane Rita which made landfall during the week the employment surveys were taken. The m/m decline in payrolls was the first in over two years, although several factors dampened its economic significance. 1) Consensus expectations had been for a for a deeper 168,000 decline. 2) August & July payrolls were revised up. 3) The less affected employment tally from the Household survey fell just 17,000.
The upward revisions to earlier months' payrolls pulled the 3Q gain in the index of aggregate hours worked (employment times hours worked) to a respectable 0.4% (1.9% y/y). Hours worked in 2Q increased 0.7% from 1Q05.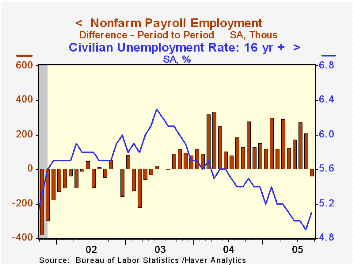
Perhaps 200,000 jobs were lost in September due to storms and in October payrolls may be reduced by another 150,000 due to the hurricanes.
Factory sector payrolls felt the brunt of the September storms and fell 27,000 following a 9,000 worker decline in August which was less than initially estimated.
Private service producing industries also were hard hit as indicated by a 67,000 (+2.0% y/y) decline in payrolls. Retail jobs fell 88,000 (+0.9% y/y) as a number of shopping malls along the Gulf Coast were leveled while jobs in trade, transportation and utilities fell 94,000 (+1.2% y/y). The leisure & hospitality industries shed 80,000 (+1.9% y/y) jobs.
On the plus side, professional & business services jobs rose 52,000 (3.3% y/y) while financial sector jobs rose 11,000 (2.1% y/y).Education & health services jobs rose 49,000 (2.7% y/y) and construction jobs increased 23,000 (4.1% y/y).
The unemployment rate from the household survey rose as expected to 5.1%. Employment fell 17,000 (+2.1% y/y) after a 373,000 gain in August and the labor force rose 252,000 (1.7% y/y).
Average hourly earnings increased a moderate, expected 0.2% and reflected a 1.7% y/y gain in factory earnings.
| Employment | Sept | Aug | Y/Y | 2004 | 2003 | 2002 |
|---|---|---|---|---|---|---|
| Payroll Employment | -35,000 | 211,000 | 1.6% | 1.1% | -0.3% | -1.1% |
| Manufacturing | -27,000 | -9,000 | -0.8% | -1.2% | -4.9% | -7.2% |
| Average Weekly Hours | 33.7 | 33.7 | 33.8 | 33.7 | 33.7 | 33.8 |
| Average Hourly Earnings | 0.2% | 0.1% | 2.6% | 2.1% | 2.7% | 2.9% |
| Unemployment Rate | 5.1% | 4.9% | 5.4% | 5.5% | 6.0% | 5.8% |
by Carol Stone October 7, 2005
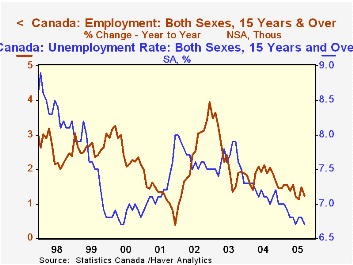
Both jobs and unemployment edged down in Canada in September. The number of jobs eased by 2,300 while the unemployment rate ticked down to 6.7% from 6.8% in August. A gradual but persistent decline in labor force participation is what produces these seemingly contradictory movements in employment and unemployment.
The jobs decrease was actually quite minor on the month. An outsized drop in finance, 29,000, actually looks a bit peculiar for that sector; other jobs decreases occurred in manufacturing, business services, wholesale and retail trade, accommodation and food services and public administration. But these job losses were almost entirely offset by a 20,000 gain in information industries, plus increases in "other" services, professional and technical services, education and health care. Employment had gained 27,500 in August, but overall, the trend in jobs growth has been slowing.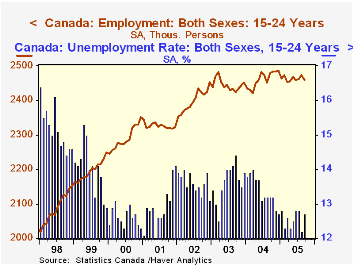
The unemployment rate returned to 6.7% after two months at 6.8%. The 6.7% level is the lowest since the same in May and June of 2000, and hadn't been undercut before that for just over 25 years. However, as we have explained a couple of times earlier this year in discussing the Canadian labor data, this low rate doesn't suggest that these labor markets are tight. The labor force also decreased marginally in September and continues to exhibit a 12-month growth rate at or below 1%. The labor force participation rate fell again. Its current 67.1% is the lowest since August 2002; it reflects a slight decrease in participation above age 25 and a bigger decline in younger people's participation. The unemployment rate for young workers is hovering around 12.5%, having come down from well over 14% just two years ago. But it is reduced participation of this age group that has helped its recent unemployment picture. Employment opportunities for them have been almost completely flat for about three years.
| CanadaAge 15 and over | Mo/Mo Change, 000sYr/Yr % Sept | December/December|||||
|---|---|---|---|---|---|---|
| Sept 2005 | Aug 2005 | 2004 | 2003 | 2002 | ||
| Employment | -2.3 | 27.5 | 1.2% | 1.5% | 1.9% | 4.0% |
| Goods- Producing | -14.5 | 24.6 | 0.4% | 2.0% | -0.5% | 6.3% |
| Service- Producing | 12.2 | 2.8 | 1.5% | 1.2% | 2.6% | 3.1% |
| Labor Force | -7.4 | -30.8 | 0.7% | 1.1% | 1.6% | 3.2% |
| Unemployment Rate | Sept 2005 | Aug 2005 | Sept 2004 | Annual Average | ||
| 6.8% | 7.0% | 7.3% | 7.2% | 7.7% | 7.7% | |
| Participation Rate | 77.8% | 78.0% | 78.3% | 78.2% | 78.1% | 77.4% |

Tom Moeller
AuthorMore in Author Profile »Prior to joining Haver Analytics in 2000, Mr. Moeller worked as the Economist at Chancellor Capital Management from 1985 to 1999. There, he developed comprehensive economic forecasts and interpreted economic data for equity and fixed income portfolio managers. Also at Chancellor, Mr. Moeller worked as an equity analyst and was responsible for researching and rating companies in the economically sensitive automobile and housing industries for investment in Chancellor’s equity portfolio. Prior to joining Chancellor, Mr. Moeller was an Economist at Citibank from 1979 to 1984. He also analyzed pricing behavior in the metals industry for the Council on Wage and Price Stability in Washington, D.C. In 1999, Mr. Moeller received the award for most accurate forecast from the Forecasters' Club of New York. From 1990 to 1992 he was President of the New York Association for Business Economists. Mr. Moeller earned an M.B.A. in Finance from Fordham University, where he graduated in 1987. He holds a Bachelor of Arts in Economics from George Washington University.
More Economy in Brief


