 Global| Jan 16 2003
CPI Weak in 2002
by:Tom Moeller
|in:Economy in Brief
Summary
The Consumer Price Index (CPI-U) rose less than expected last month. Excluding food and energy, prices rose as expected. The core CPI less tobacco rose 0.1% (1.9% y/y). For the full year, the average gain in prices rivaled the 1.5% [...]

The Consumer Price Index (CPI-U) rose less than expected last month. Excluding food and energy, prices rose as expected. The core CPI less tobacco rose 0.1% (1.9% y/y).
For the full year, the average gain in prices rivaled the 1.5% rise in 1998 and these were the lowest increases since 1965. The 2.3% average gain in core consumer prices was at the low end of the 2.3%-2.7% range in place since 1996.
Goods prices fell for the third consecutive month and for the eighth month of 2002. Household furnishings and operation prices fell 0.5% (-1.5% y/y). Apparel prices dropped 0.5% (-1.8% y/y). New and used vehicle prices fell 0.4% (-2.9% y/y), down for the third consecutive month.
Core services prices rose by the least amount in three months. Shelter prices rose just 0.2% (3.2% y/y). Medical care services prices rose 0.4% (5.6% y/y), the least since September. Education and communication prices rose 0.2% (2.2% y/y). Public transportation prices were relatively strong rising 0.7% (-0.9% y/y) following s strong November gain.
Energy prices fell last month led by a 1.5% decline in gasoline prices (+24.7% y/y), the second in a row. Fuel and utility prices rose 0.5% (1.5% y/y. Fuel oil prices rose 11.5% last year but piped gas & electricity prices were up only 0.5%.
The chained CPI, which correlates closely with the PCE price deflator, fell for both the total and for the core measures.
For analysis of health care costs and coverage by the St. Louis Federal Reserve click here.
| Consumer Price Index | Dec | Nov | Y/Y | 2002 | 2001 | 2000 |
|---|---|---|---|---|---|---|
| Total | 0.1% | 0.1% | 2.4% | 1.6% | 2.8% | 3.4% |
| Total less Food & Energy | 0.1% | 0.2% | 2.0% | 2.3% | 2.7% | 2.4% |
| Goods less Food & Energy | -0.3% | -0.3% | -1.5% | -1.1% | 0.3% | 0.5% |
| Services less Energy | 0.2% | 0.3% | 3.5% | 3.8% | 3.7% | 3.3% |
| Energy | -0.4% | -0.2% | 11.0% | -5.8% | 3.7% | 16.9% |
| Food & Beverages | 0.3% | 0.2% | 1.5% | 1.8% | 3.1% | 2.3% |
| Chained CPI: Total (NSA) | -0.3% | -0.1% | 2.1% | 1.2% | 2.1% | 2.0% |
| Total less Food & Energy | -0.3% | 0.0% | 1.4% | 1.7% | 1.9% | 1.4% |
by Tom Moeller January 16, 2003
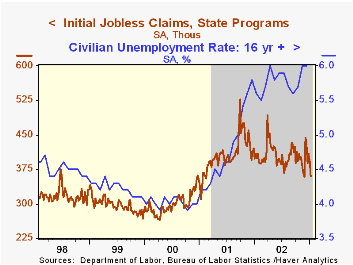
Initial claims for unemployment insurance fell much more than expected last week. Claims fell 32,000 from the prior week's level which was revised slightly higher.
The four-week moving average of initial claims fell to 387,500, the lowest level since late November (-5.5% y/y).
Continuing claims for unemployment insurance fell a sharp 4.0%, also to the lowest level since late November. The prior week's level was revised down slightly. The recently announced program to extend unemployment insurance benefits will have no effect on these figures.
The insured rate of unemployment fell slightly to 2.6%.
| Unemployment Insurance (000s) | 1/11/03 | 1/04/03 | Y/Y | 2002 | 2001 | 2000 |
|---|---|---|---|---|---|---|
| Initial Claims | 360.0 | 392.0 | -11.8% | 405.0 | 405.8 | 299.8 |
| Continuing Claims | -- | 3,293 | -5.7% | 3,587 | 3,021 | 2,114 |
by Tom Moeller January 16, 2003
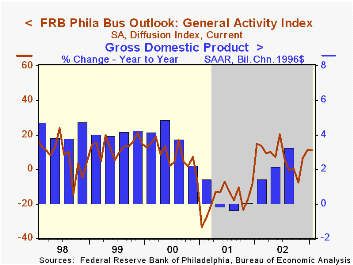
The Philadelphia Fed’s index of general business conditions was about unchanged in January versus the upwardly revised level of last month. The Business Activity Index was 11.2, down slightly from 11.3 in December. The figures reflect benchmark revisions which updated seasonal adjustment factors.
The reading contrasted with the sharp improvement reported yesterday in the Empire State General Conditions Index for January.
Amongst the sub indexes new orders and shipments rose but employment and inventories fell versus December.
The business conditions index reflects a separate survey question, not the components.
The Philadelphia Fed index is based on a survey of 250 regional manufacturing firms, but these firms sell nationally and internationally.
During the last ten years there has been a 64% correlation between the level of the General Activity Index and annual growth in real GDP.
For a discussion of the Philadelphia Fed's Business Outlook Survey click here.
| Philadelphia Fed Business Outlook | Jan | Dec | Y/Y | 2002 | 2001 | 2000 |
|---|---|---|---|---|---|---|
| General Activity Index | 11.2 | 11.3 | 15.2 | 7.7 | -17.2 | 8.3 |
| Prices Paid Index | 11.6 | 17.7 | -5.4 | 12.2 | -0.9 | 27.2 |

Tom Moeller
AuthorMore in Author Profile »Prior to joining Haver Analytics in 2000, Mr. Moeller worked as the Economist at Chancellor Capital Management from 1985 to 1999. There, he developed comprehensive economic forecasts and interpreted economic data for equity and fixed income portfolio managers. Also at Chancellor, Mr. Moeller worked as an equity analyst and was responsible for researching and rating companies in the economically sensitive automobile and housing industries for investment in Chancellor’s equity portfolio. Prior to joining Chancellor, Mr. Moeller was an Economist at Citibank from 1979 to 1984. He also analyzed pricing behavior in the metals industry for the Council on Wage and Price Stability in Washington, D.C. In 1999, Mr. Moeller received the award for most accurate forecast from the Forecasters' Club of New York. From 1990 to 1992 he was President of the New York Association for Business Economists. Mr. Moeller earned an M.B.A. in Finance from Fordham University, where he graduated in 1987. He holds a Bachelor of Arts in Economics from George Washington University.
More Economy in Brief


