 Global| May 17 2006
CPI Up 0.6% Due To Energy & Services
by:Tom Moeller
|in:Economy in Brief
Summary
The April consumer price index (CPI-U) rose 0.6%, the most for any month since a 0.7% rise in January and matched Consensus expectations. For the second month, however, a 0.3% rise in prices less food & energy was firmer than [...]
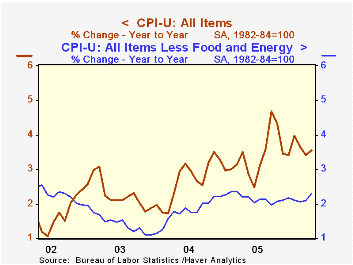
The April consumer price index (CPI-U) rose 0.6%, the most for any month since a 0.7% rise in January and matched Consensus expectations. For the second month, however, a 0.3% rise in prices less food & energy was firmer than expected.
An 8.8% m/m jump in gasoline prices (21.5% y/y) caused energy prices to spike 3.9% and in May gas prices have moved another 6.7% higher to an average $2.93 per gallon. Fuel oil prices also were strong last month and posted a 4.0% (18.6% y/y) gain while natural gas & electricity prices fell 1.5% (+14.1% y/y) for the fourth decline in the last five months.
A 0.3% increase last month in core services prices provided additional lift to last month's rise in the "core" CPI. That reflected a 0.3% (2.9% y/y) rise in shelter prices as well as a 0.5% (6.0% y/y) gain in education expenses. Medical care services prices rose 0.3% (4.1% y/y), the smallest rise in three months and public transportation prices increased for the first month in the last three, by 0.2% (4.8% y/y).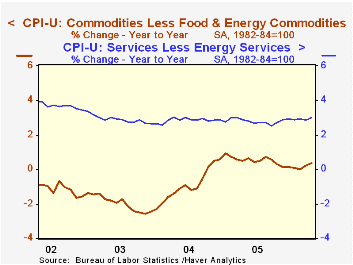
Prices for core goods rose just 0.1% (0.4% y/y), further suggesting that the pass-through of higher energy prices has been limited. Apparel prices did jump 0.6% (-0.2% y/y) following a 1.0% March spike but window & floor coverings prices fell 1.6% (-4.5% y/y) and household appliance prices rose a modest 0.1% (1.3% y/y). New & used motor vehicle prices also rose a slim 0.1% (0.3% y/y) and tobacco prices fell 0.2% +4.2% y/y). Medical care commodity prices rose 0.4% (4.3% y/y).
Food prices were unchanged, an increase held back by a 0.7% (-0.5% y/y) decline in dairy products and another 0.1% decline (+2.6% y/y) drop in fruits & vegetables prices. Meat, fish & poultry prices rose 0.2% (0.5% y/y).
The chained CPI, which adjusts for shifts in the mix of consumer purchases, increased 0.6% and less food & energy prices rose 0.3%, half the prior month's gain.
Gas-Price Inflation from the Federal Reserve Bank of St. Louis can be found here.
| Consumer Price Index | April | Mar | Y/Y | 2005 | 2004 | 2003 |
|---|---|---|---|---|---|---|
| Total | 0.6% | 0.4% | 3.6% | 3.4% | 2.7% | 2.3% |
| Total less Food & Energy | 0.3% | 0.3% | 2.3% | 2.2% | 1.8% | 1.5% |
| Goods less Food & Energy | 0.1% | 0.3% | 0.4% | 0.5% | -0.9% | -2.0% |
| Services less Energy | 0.3% | 0.3% | 3.0% | 2.8% | 2.8% | 2.9% |
| Energy | 3.9% | 1.3% | 17.9% | 16.9% | 10.8% | 12.2% |
| Food | 0.0% | 0.1% | 1.8% | 2.4% | 3.4% | 2.1% |
| Chained CPI: Total (NSA) | 0.6% | 0.5% | 3.1% | 2.9% | 2.5% | 2.0% |
| Total less Food & Energy | 0.3% | 0.6% | 2.1% | 1.9% | 1.7% | 1.1% |
by Tom Moeller May 17, 2006
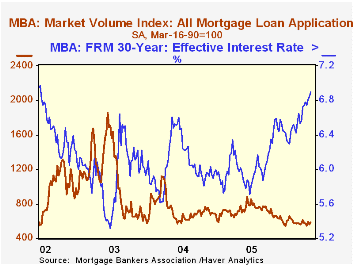
Last week, the total number of mortgage applications recovered most of the prior week's decline with a 4.6% gain. The rise lifted the average level in May 0.3% above the April average.
Purchase applications rose 2.4% following a 3.9% w/w decline the prior week. As a result, purchase applications in May are 2.3% ahead of April which rose 1.1% versus March.
During the last ten years there has been a negative 80% correlation between the interest rate level on 30-year financing and purchase applications while during those years there has been a 54% correlation between the y/y change in purchase applications and the change in new plus existing single family home sales.
Applications to refinance recovered about all of the prior week's decline with an 8.4% rise. Nevertheless, the May level is 2.7% below the April average which fell 4.1% from March.
The effective interest rate on a conventional 30-year mortgage jumped to 6.90% from 6.84% the prior week and the rate on 15-year financing increased to 6.55%. Rates have risen roughly 50 basis points since year end 2005. Interest rates on 15 and 30 year mortgages are closely correlated (>90%) with the rate on 10 year Treasury securities and during the last ten years there has been a (negative) 82% correlation between purchase applications and the effective rate on a 30-Year mortgage.
The Mortgage Bankers Association surveys between 20 to 35 of the top lenders in the U.S. housing industry to derive its refinance, purchase and market indexes. The weekly survey accounts for more than 40% of all applications processed each week by mortgage lenders. Visit the Mortgage Bankers Association site here.
| MBA Mortgage Applications (3/16/90=100) | 05/12/06 | 05/05/06 | Y/Y | 2005 | 2004 | 2003 |
|---|---|---|---|---|---|---|
| Total Market Index | 588.0 | 562.1 | -15.9% | 708.6 | 735.1 | 1,067.9 |
| Purchase | 426.7 | 416.5 | -9.1% | 470.9 | 454.5 | 395.1 |
| Refinancing | 1,546.8 | 1,427.4 | -24.1% | 2,092.3 | 2,366.8 | 4,981.8 |
by Tom Moeller May 17, 2006
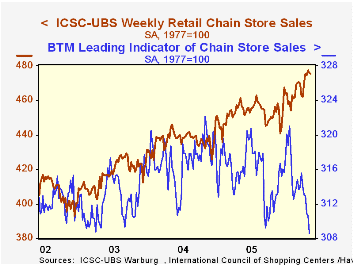
Chain store sales were unchanged last week, according to the International Council of Shopping Centers (ICSC)-UBS survey, after a modest 0.4% decline to open the month. So far, sales in May are 0.3% ahead of the April average which rose 1.6% from March.
During the last ten years there has been a 47% correlation between the y/y change in chain store sales and the change in nonauto retail sales less gasoline.The ICSC-UBS retail chain-store sales index is constructed using the same-store sales (stores open for one year) reported by 78 stores of seven retailers: Dayton Hudson, Federated, Kmart, May, J.C. Penney, Sears and Wal-Mart.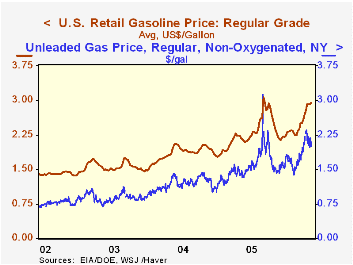
Retail gasoline prices rose four cents last week to $2.95 per gallon, however, yesterday spot market gasoline prices dropped again and the NY price is off nearly a dime from last week.
The latest Short-Term Energy Outlook from the US Energy Information Administration is available here.
| ICSC-UBS (SA, 1977=100) | 05/13/06 | 05/06/06 | Y/Y | 2005 | 2004 | 2003 |
|---|---|---|---|---|---|---|
| Total Weekly Chain Store Sales | 475.7 | 475.9 | 3.1% | 3.6% | 4.7% | 2.9% |
by Carol Stone May 17, 2006
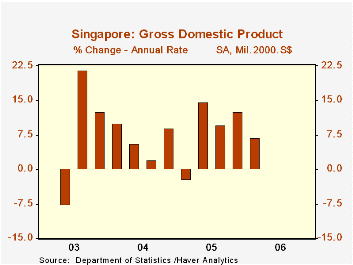
Singapore's economy turned in a much better than expected performance in Q1, with its GDP up 6.8% annualized from Q4 and 10.6% from a year ago. Forecasts had called for a greater slowdown after the strong close to 2005 in Q4, when GDP was up 12.5% from Q3. The good gain prompted the Singapore government to raise its official forecast for the entire year from 4%-6% projected in February to 5%-7%.
On a year-over-year basis, both goods- and service-producing sectors participated in the good growth. Goods were led by manufacturing, which expanded by 20%. Press reports cited strength in electronic products, a sizable portion of manufacturing in Singapore. Also, among the industry "cluster" data compiled by the Singapore Economic Development Board, biomedical production and transport engineering were also very strong.
Value added in service industries gained 8.1% year-on-year, its best showing since Q2 2004. Wholesale and retail trade was a leader here, reflecting, according to the Department of Statistics, the movement of re-exports, which expanded 39.5% from a year ago in current prices.
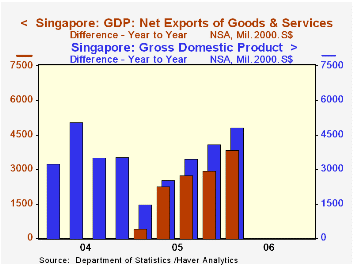
Net exports were a leading source of demand, accounting for nearly 80% of the yearly GDP growth. Among domestic sectors, demand for machinery and equipment increased 19% from a year ago.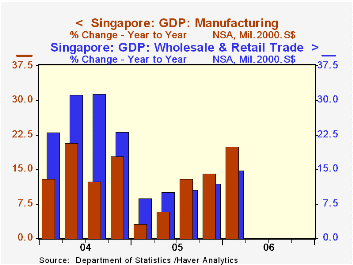
| Singapore | Q1 2006 | Q4 2005 | Q3 2005 | Q2 2005 | 2005 | 2004 |
|---|---|---|---|---|---|---|
| GDP Qtr/Qtr | 6.8 | 12.5 | 9.6 | 14.6 | -- | -- |
| Year/Year | 10.6 | 8.6 | 7.6 | 5.7 | 6.4 | 9.2 |
| Goods Producing (Yr/Yr) | 16.3 | 12.0 | 10.7 | 4.9 | 7.7 | 8.6 |
| Service Producing (Yr/Yr) | 8.1 | 7.2 | 6.8 | 5.8 | 6.0 | 7.1 |

Tom Moeller
AuthorMore in Author Profile »Prior to joining Haver Analytics in 2000, Mr. Moeller worked as the Economist at Chancellor Capital Management from 1985 to 1999. There, he developed comprehensive economic forecasts and interpreted economic data for equity and fixed income portfolio managers. Also at Chancellor, Mr. Moeller worked as an equity analyst and was responsible for researching and rating companies in the economically sensitive automobile and housing industries for investment in Chancellor’s equity portfolio. Prior to joining Chancellor, Mr. Moeller was an Economist at Citibank from 1979 to 1984. He also analyzed pricing behavior in the metals industry for the Council on Wage and Price Stability in Washington, D.C. In 1999, Mr. Moeller received the award for most accurate forecast from the Forecasters' Club of New York. From 1990 to 1992 he was President of the New York Association for Business Economists. Mr. Moeller earned an M.B.A. in Finance from Fordham University, where he graduated in 1987. He holds a Bachelor of Arts in Economics from George Washington University.
More Economy in Brief


