 Global| Nov 18 2009
CPI Increases Remain Moderate
by:Tom Moeller
|in:Economy in Brief
Summary
Pricing pressure continued under control last month. The overall October CPI roughly matched Consensus expectations and rose 0.3%, despite energy prices which rose m/m. Stripping out both energy & food prices, consumer prices [...]
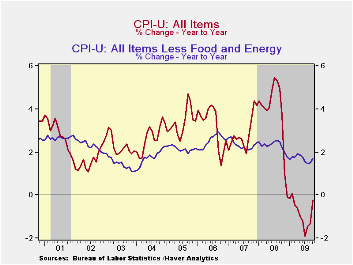 Pricing
pressure continued under control last month. The overall October CPI
roughly matched Consensus expectations and rose 0.3%, despite energy
prices which rose m/m. Stripping out both energy & food prices,
consumer prices increased 0.2% as they did during September. However,
the y/y increase in "core" prices picked up modestly to 1.7% from its
weakest since early-2004.
Pricing
pressure continued under control last month. The overall October CPI
roughly matched Consensus expectations and rose 0.3%, despite energy
prices which rose m/m. Stripping out both energy & food prices,
consumer prices increased 0.2% as they did during September. However,
the y/y increase in "core" prices picked up modestly to 1.7% from its
weakest since early-2004.
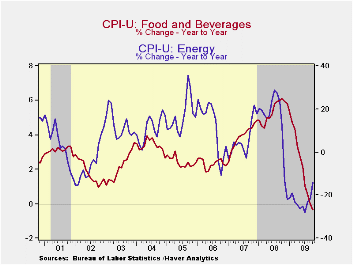 Energy
prices continued their
recovery with a 1.5% m/m increase, bringing the three-month annual rate
of growth to 30.1%. Fuel oil prices surged 6.0% (-23.5% y/y) after
smaller gains during the prior two months while gasoline prices
increased another 1.6% (-17.9% y/y) following a 1.0% gain during
September. Finally, prices for natural gas & electricity rose
0.9% (-7.2% y/y) after little change during the prior two months.
Energy
prices continued their
recovery with a 1.5% m/m increase, bringing the three-month annual rate
of growth to 30.1%. Fuel oil prices surged 6.0% (-23.5% y/y) after
smaller gains during the prior two months while gasoline prices
increased another 1.6% (-17.9% y/y) following a 1.0% gain during
September. Finally, prices for natural gas & electricity rose
0.9% (-7.2% y/y) after little change during the prior two months.
Food & beverage prices continued weak last month with a 0.1% uptick. So far this year, food prices have fallen an unprecedented 0.6%. Recent weakness has been led by lower dairy prices (-8.2% y/y) and lower fruit & vegetable (-5.6% y/y) costs. Prices for meats, poultry, fish & eggs also fell 4.8% y/y while cereals & bakery product prices were off 0.6%.
 Inflation
in the CPI less food &
energy also remained moderate but, like the previous month, the 0.2%
October increase was slightly firmer than expected. Price gains
accelerated to a 2.0% annual rate since December of last year. That's
only slightly below the 2.3% rates of increase during the last two
years.
Inflation
in the CPI less food &
energy also remained moderate but, like the previous month, the 0.2%
October increase was slightly firmer than expected. Price gains
accelerated to a 2.0% annual rate since December of last year. That's
only slightly below the 2.3% rates of increase during the last two
years.
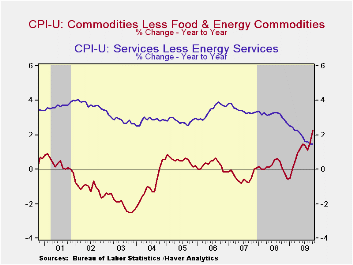
Despite the weak economy, the acceleration in core price inflation this year owes to faster increases in core goods prices. Their 0.4% increase last month lifted the annualized rate so far in 2009 to 3.2% from no change during the prior two years. Higher tobacco prices continued to account for much of that acceleration. In addition, there has been a firming of prices elsewhere. Prices for new & used motor vehicles have firmed despite an aggressive marketing campaign, up 1.7% last month and at a 5.2% rate since December. They rose 0.3% last month and at a 35.0% annual rate since December. That compares with price deflation during the last two years. Though apparel prices ticked 0.4% lower last month they've risen at an accelerated 2.3% rate this year. That follows price declines which extends back to 1994. Continuing weak were prices for household furnishings & operation. They fell another 0.5% leaving them down at a 1.0% rate so far this year.
The U.S. recession continued to hold back growth in core services prices. Again, they ticked up just 0.1% last month and have risen at a 1.5% annual rate so far this year, half that in 2008 and nearly the weakest since 1983. Weakness in the housing market accounts for much of that moderation. Last month, shelter prices were unchanged and they've risen at a just a 0.6% annual rate so far in 2009. Owners equivalent rent of primary residences, a measure not equivalent to other house price measures, again slipped m/m and have risen at a 1.0% rate so far this year versus a 2.5% 2008 increase. Elsewhere in services, public transportation prices again were strong and rose 0.9% (-4.5% y/y). Medical care services prices ticked up 0.2% but at a 3.4% rate this year. That compares to a 4.2% increase last year. Finally, education costs have been firm and they're up at a 4.9% annual rate this year after a 5.8% gain during 2008. However, recreation prices are roughly unchanged this year after a 1.6% 2008 gain.
The chained CPI, which adjusts for shifts in consumption patterns, rose 0.1% during October while year-to-year prices fell 0.5%. Conversely, chained prices less food and energy firmed last month by 0.3%, only the second material gain in five months.
The consumer price data is available in Haver's USECON database while detailed figures can be found in the CPIDATA database.
| Consumer Price Index (%) | October | Oct. Y/Y | September | August | 2008 | 2007 | 2006 |
|---|---|---|---|---|---|---|---|
| Total | 0.3 | -0.2 | 0.2 | 0.4 | 3.8 | 2.9 | 3.2 |
| Total less Food & Energy | 0.2 | 1.7 | 0.2 | 0.1 | 2.3 | 2.3 | 2.5 |
| Goods less Food & Energy | 0.4 | 2.3 | 0.3 | -0.3 | 0.1 | -0.4 | 0.2 |
| Services less Energy | 0.1 | 1.5 | 0.1 | 0.2 | 3.1 | 3.4 | 3.4 |
| Energy | 1.5 | -14.1 | 0.6 | 4.6 | 13.5 | 5.7 | 11.0 |
| Food & Beverages | 0.1 | -0.3 | -0.1 | 0.1 | 5.4 | 3.9 | 2.3 |
| Chained CPI: Total (NSA) | 0.1 | -0.5 | 0.1 | 0.2 | 3.3 | 2.5 | 2.9 |
| Total less Food & Energy | 0.3 | 1.3 | 0.2 | 0.1 | 2.0 | 2.0 | 2.2 |
EMU Trade Balance Improves
by Robert Brusca November 18, 2009
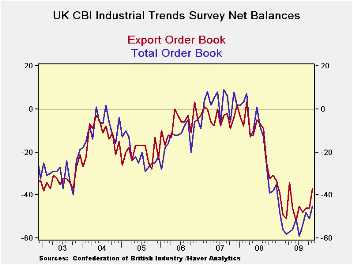 The Confederation of British
Industry survey shows
industrial trends continue to make progress and cut their declining
trends. Still the declining trends remain large and the degree of
progress is slow although this month’s gain in orders is one of the
sharpest.
The Confederation of British
Industry survey shows
industrial trends continue to make progress and cut their declining
trends. Still the declining trends remain large and the degree of
progress is slow although this month’s gain in orders is one of the
sharpest.
Total orders revived to -45 from -51 a still steep negative reading but a substantial month-to-month gain in November. Export orders, following the pattern of other EU countries, have made even grater progress this month improving to -37 from -46.
Overall orders bottomed in the cycle at -59 in July and the series has only clawed back to -45 by November. This month’s six point gain month to month gain is twice the pace of the rise from the cycle low (approx 3.5 per month). The surge in export orders this month is even more impressive on that score since those orders had only been rising by 3 points per month from their cycle low compared to this month’s jump of nine points.
The outlook for the volume of output has improved rapidly from its cycle low of -48 in March of this year. Its rapid increases came in April, May and in August. In October the outlook index for volume switched to a positive reading and this month it holds that same reading of +4. Although the month to month improvement in the volume outlook index has stagnated this month, the level of the reading staying in positive territory still marks it as a good result.
The survey evidence is that British industry sees itself improving and expects that to continue. Overall orders are showing strong improving profiles and are being spurred substantially by export orders. While orders have a long way to go to become a truly positive reading, the outlook of the British industry survey respondents says they expect it to get there. On balance the survey is a good result.
| UK Industrial volume data CBI Survey | ||||||||||
|---|---|---|---|---|---|---|---|---|---|---|
| Reported: | Nov 09 |
Oct 09 |
Sep 09 |
Aug 09 |
Jul 09 |
12MO Avg |
Pcntle | Max | Min | Range |
| Total Orders | -45 | -51 | -48 | -54 | -59 | -51 | 21% | 9 | -59 | 68 |
| Export Orders | -37 | -46 | -46 | -48 | -45 | -43 | 27% | 3 | -52 | 55 |
| Stocks:FinGds | 20 | 10 | 13 | 13 | 20 | 23 | 67% | 31 | -2 | 33 |
| Looking ahead | ||||||||||
| Output Volume:Nxt 3M | 4 | 4 | -2 | -5 | -14 | -28 | 68% | 28 | -48 | 76 |
| Avg Prices 4 Nxt 3m | -5 | -4 | -10 | -17 | -6 | -10 | 28% | 34 | -20 | 54 |
U.S. Housing Starts Fall To Their Lowest Level Since April
by Tom Moeller November 18, 2009
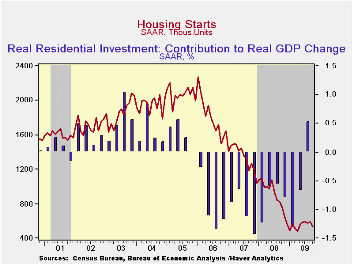 Housing
sector activity continued to moderate after increases this past spring.
Housing starts fell last month to 529,000 (AR) units versus 592,000
during September which was revised up slightly. The latest level was
the lowest since April and down nearly one-third y/y. More sobering was
that since the peak in January of 2006 starts have fallen by more than
three-quarters. In addition, October's figure fell well short of
Consensus expectations for 600,000 starts.
Housing
sector activity continued to moderate after increases this past spring.
Housing starts fell last month to 529,000 (AR) units versus 592,000
during September which was revised up slightly. The latest level was
the lowest since April and down nearly one-third y/y. More sobering was
that since the peak in January of 2006 starts have fallen by more than
three-quarters. In addition, October's figure fell well short of
Consensus expectations for 600,000 starts.
Loss of forward momentum was evident in the decline in starts of single-family homes. They fell 3.9% last month to 476,000 units (AR), reversed all of the prior month's increase and were at the lowest level since May. Despite these disappointments, however, single-family starts were one-third higher than the February low. During the last ten years, there has been an 84% correlation between the q/q change in single-family starts and their contribution to quarterly GDP growth.
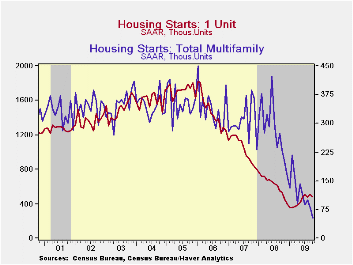 A further
loss of momentum was evident in the multi-family sector where
starts starts fell by one-third m/m during October to the record low.
Starts of apartments, condominiums & town houses were down
88.2% from the January 2006 peak.
A further
loss of momentum was evident in the multi-family sector where
starts starts fell by one-third m/m during October to the record low.
Starts of apartments, condominiums & town houses were down
88.2% from the January 2006 peak.
Starts of single-family units fell throughout the country last month. Single-family starts in the Northeast fell 9.6% (-17.5% y/y) while starts in the South fell 7.3% (-4.9% y/y). In the Midwest starts declined 4.8% (-16.8% y/y) and starts in the West fell 5.9% (-16.5% y/y) to their lowest level since May.
Building permits dropped 4.0%, the third decline in four months, but remained 10.8% above their record low reached in April. As with starts, permits to build a single-family home have been relatively strong. They fell just 0.2% last month and were down 4.0% y/y.
The housing starts figures can be found in Haver's USECON database.
How Rigid Are Producer Prices? from the Federal Reserve Bank of New York can be found here.
| Housing Starts (000s, SAAR) | October | Oct. Y/Y | September | August | 2008 | 2007 | 2006 |
|---|---|---|---|---|---|---|---|
| Total | 529 | -30.7% | 592 | 581 | 900 | 1,342 | 1,812 |
| Single-Family | 476 | -10.9 | 511 | 481 | 616 | 1,036 | 1,474 |
| Multi-Family | 53 | -76.9 | 81 | 100 | 285 | 306 | 338 |
| Building Permits | 552 | -24.3 | 575 | 580 | 895 | 1,392 | 1,844 |
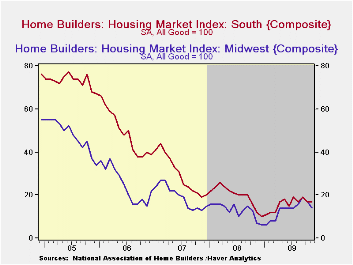
U.S. Home Builders’ Index Recovery Stuttering Again This Month
by Tom Moeller November 18, 2009
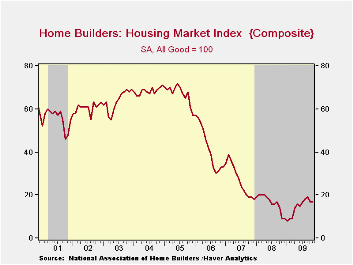 Since
the spring recovery, housing activity has been roughly flat according
to The National Association of Home Builders. They reported that its
November Composite Housing Market Index held stable with a downwardly
revised October reading. Though the index remained double the low of 8
this past January there's been little, if any, improvement during the
last several months. The index is compiled from survey questions asking
builders to rate market conditions as “good”, “fair”, “poor” or “very
high” to “very low”. The figure is a
diffusion index, therefore, numerical results over 50 indicate a
predominance of “good” readings.
Since
the spring recovery, housing activity has been roughly flat according
to The National Association of Home Builders. They reported that its
November Composite Housing Market Index held stable with a downwardly
revised October reading. Though the index remained double the low of 8
this past January there's been little, if any, improvement during the
last several months. The index is compiled from survey questions asking
builders to rate market conditions as “good”, “fair”, “poor” or “very
high” to “very low”. The figure is a
diffusion index, therefore, numerical results over 50 indicate a
predominance of “good” readings.
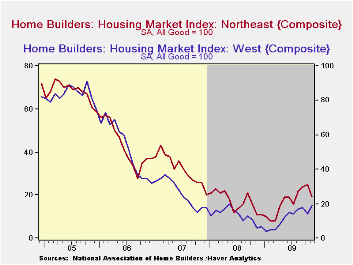 The present sales
index held stable at 17 which equaled the 3Q average. In the West the
index rose slightly and was sharply higher than one year ago. In the
South the index also held stable m/m (+41.7% y/y). In the Northeast the
index fell m/m but remained three-quarters higher than the year-ago
level. In the Midwest the index also fell m/m but remained
double last year. The sub-index of sales during the next six months
rose slightly m/m and offset most of the October decline.
· The Home Builders' Association also reported that traffic of
prospective buyers held stable with October at the lowest level since
July.</p><p>The Home Builders' Housing
Opportunity Index,
which is the share of homes sold that could be considered affordable to
a family earning the median income, fell slightly in the second
quarter. It had jumped earlier to a record high of 72.5% buoyed by
lower home prices, lower interest rates and higher income. (There is a
break in the series from 2002 to 2003.)
The present sales
index held stable at 17 which equaled the 3Q average. In the West the
index rose slightly and was sharply higher than one year ago. In the
South the index also held stable m/m (+41.7% y/y). In the Northeast the
index fell m/m but remained three-quarters higher than the year-ago
level. In the Midwest the index also fell m/m but remained
double last year. The sub-index of sales during the next six months
rose slightly m/m and offset most of the October decline.
· The Home Builders' Association also reported that traffic of
prospective buyers held stable with October at the lowest level since
July.</p><p>The Home Builders' Housing
Opportunity Index,
which is the share of homes sold that could be considered affordable to
a family earning the median income, fell slightly in the second
quarter. It had jumped earlier to a record high of 72.5% buoyed by
lower home prices, lower interest rates and higher income. (There is a
break in the series from 2002 to 2003.)
 The NAHB
has compiled the Housing Market Index since 1985. The weights assigned
to the individual index components are .5920 for single family detached
sales, present time; .1358 for single family detached sales, next six
months; and .2722 for traffic of prospective buyers. The results, along
with other housing and remodeling indexes from NAHB Economics, are
included in Haver’s SURVEYS database.
The NAHB
has compiled the Housing Market Index since 1985. The weights assigned
to the individual index components are .5920 for single family detached
sales, present time; .1358 for single family detached sales, next six
months; and .2722 for traffic of prospective buyers. The results, along
with other housing and remodeling indexes from NAHB Economics, are
included in Haver’s SURVEYS database.
| Nat'l Association of Home Builders | November | October | September | November '08 | 2008 | 2007 | 2006 |
|---|---|---|---|---|---|---|---|
| Composite Housing Market Index (All Good = 100) | 17 | 17 | 19 | 9 | 16 | 27 | 42 |
| Single-Family Sales | 17 | 17 | 18 | 9 | 16 | 27 | 45 |
| Single-Family Sales: Next Six Months | 28 | 26 | 29 | 18 | 25 | 37 | 51 |
| Traffic of Prospective Buyers | 13 | 13 | 17 | 7 | 14 | 21 | 30 |

Tom Moeller
AuthorMore in Author Profile »Prior to joining Haver Analytics in 2000, Mr. Moeller worked as the Economist at Chancellor Capital Management from 1985 to 1999. There, he developed comprehensive economic forecasts and interpreted economic data for equity and fixed income portfolio managers. Also at Chancellor, Mr. Moeller worked as an equity analyst and was responsible for researching and rating companies in the economically sensitive automobile and housing industries for investment in Chancellor’s equity portfolio. Prior to joining Chancellor, Mr. Moeller was an Economist at Citibank from 1979 to 1984. He also analyzed pricing behavior in the metals industry for the Council on Wage and Price Stability in Washington, D.C. In 1999, Mr. Moeller received the award for most accurate forecast from the Forecasters' Club of New York. From 1990 to 1992 he was President of the New York Association for Business Economists. Mr. Moeller earned an M.B.A. in Finance from Fordham University, where he graduated in 1987. He holds a Bachelor of Arts in Economics from George Washington University.
More Economy in Brief


