 Global| Sep 16 2009
CPI Headline Pops but Core Rate Flat Lines
Summary
Headline rises 0.4% core rises 0.1% for second month in a row The summary table shows that inflation remains contained for the most part. Energy prices rose 8.5% in August slamming the headline and lien items with energy in them. But [...]
Headline rises 0.4% core rises 0.1% for second month in a row
The summary table shows that inflation remains contained for
the most part. Energy prices rose 8.5% in August slamming the headline
and lien items with energy in them. But core CPI trends remain
controlled. Inflation diffusion rose above 50 to 58.9 in August
implying that inflation rose m/m in more CPI categories than it fell.
But core diffusion was at 48.6 implying that inflation FELL m/m in more
CORE categories in which it rose and that was with the core pace at
+0.1%. That is pretty impressive.
Over three-months: Red figures in the table
above flag four top panel categories as having accelerating inflation
over three-months: Food and beverages where inflation has ‘risen’ to
-0.2% from -1.1% over six months; Housing where at -0.6% over three
months inflation compares to a pace of -0.8% over six months; Apparel
and upkeep where the inflation’s pace shot up to 4.8% over three-months
compared to 1.2% over six months; and, transportation where energy
prices are at work driving the price index up at a 30% pace over
three-months compared to 12.6% over six months. On balance these are
not worrisome developments Transportation is mostly energy prices,
housing costs are tame despite being hit by rising utilities and energy
costs, food and beverage prices are still falling despite
‘accelerating.’ Apparel prices we will see about; but the series is
very volatile and prices tend to run hot and cold without much trend;
indeed despite the high 3-month trend, apparel prices fell in the month
are up by only 0.6% Yr/yr.
These observations underscore several points: that energy
inflation is not always passed along and that it is hard to tell price
volatility from true inflation in the month-to-month reports. So we use
the diffusion results to help guide us and they are very good this
month.
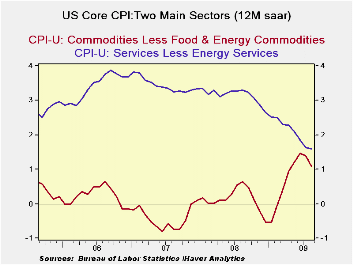
Core Services: Core inflation for services
(excluding energy) appears to be mostly steady at the 1.5% level or so.
Twelve month six-month and three-month inflation trends all converge
around that 1.5% pace which is a very low pace for the service sector
where productivity is lower than for goods making input price pressures
harder to fight-off. Still, all that is going well.
Core Goods: Core goods inflation (excluding
food and energy) had spurted early in the year but it is settling down.
Three-month and Yr/Yr inflation rates are right at the 1% mark but over
six months core goods inflation is still a bit higher at 2.7%, and it
is still coming down from its cyclical peak rate. The trends are good.
| Consumer Prices: 2009 August Report | ||||||||
|---|---|---|---|---|---|---|---|---|
| Overview: Controlled after last month's spurting headline | ||||||||
| Quick Summary | Year-To-Date | One Mo. | Mo/Mo | |||||
| Yr/Yr | 6-Mo a.r. | 3-Mo a.r. | 2009 | 2008 | Diffusion | Aug.2009 | ||
| CPI | -1.4% | 2.3% | 4.9% | -- | 2.7% | 4.9% | 58.9 | NOT |
| Core CPI | 1.5% | 1.9% | 1.4% | -- | 1.9% | 2.4% | 48.6 | Annualized |
| Commodity Category | Mon a.r. | Annualized Inflation Rate For Last: | ||||||
| By Expenditure Category | Aug.2009 | % Weight | 3-Mos | 6-Mos | Year | Month | ||
| All Items | 5.5% | 100.00 | 4.9% | -- | 2.3% | -- | -1.4% | 0.4% |
| Food and Beverages | 1.1% | 16.20 | -0.2% | -- | -1.1% | -- | 0.6% | 0.1% |
| Housing | 0.6% | 39.98 | -0.6% | -- | -0.8% | -- | -0.6% | 0.1% |
| Apparel & Upkeep | -1.1% | 4.45 | 4.8% | -- | 1.2% | -- | 0.6% | -0.1% |
| Transportation | 31.5% | 17.57 | 30.1% | -- | 12.6% | -- | -10.7% | 2.3% |
| Medical care | 3.5% | 5.81 | 2.7% | -- | 3.1% | -- | 3.3% | 0.3% |
| Recreation | 1.3% | 5.91 | 2.4% | -- | 2.9% | -- | 3.7% | 0.5% |
| Educucation & Communication | 2.0% | 5.31 | 2.5% | -- | 3.2% | -- | 3.2% | 0.2% |
| Other Goods & Services | 1.1% | 4.77 | 4.6% | -- | 13.1% | -- | 7.4% | 0.1% |
| By Industry Group | ||||||||
| Nondurables (NSA) | 20.9% | 31.26 | 17.4% | 6.2% | -5.5% | 1.6% | ||
| Durables | -7.3% | 10.57 | -1.2% | 0.5% | -1.5% | -0.6% | ||
| Services | 2.4% | 58.17 | 1.1% | 0.5% | 0.7% | 0.2% | ||
| By Economic Group | ||||||||
| All: Excl Food & Energy | 0.8% | 77.10 | 1.4% | 1.9% | 1.5% | 0.1% | ||
| (Median Increase) | 1.2% | 100.00 | 0.9% | 0.9% | 0.8% | 0.1% | ||
| Excl. Energy | 0.9% | 92.32 | 1.1% | 1.4% | 1.3% | 0.1% | ||
| Commodities: Excl Food & Energy | -3.6% | 22.77 | 1.0% | (29% of core) | 2.7% | 1.1% | -0.3% | |
| Services: Excl Energy | 2.6% | 54.33 | 1.6% | (71% of core) | 1.6% | 1.6% | 0.2% | |
| Core CPI less Tobacco | 0.8% | 1.3% | 1.4% | 1.2% | 0.1% | |||
| Food & Energy | ||||||||
| Energy | 167.6% | 7.68 | 148.5% | 42.2% | -30.8% | 8.5% | ||
| Food | 1.0% | 15.22 | -0.5% | -1.4% | 0.4% | 0.1% | ||

Robert Brusca
AuthorMore in Author Profile »Robert A. Brusca is Chief Economist of Fact and Opinion Economics, a consulting firm he founded in Manhattan. He has been an economist on Wall Street for over 25 years. He has visited central banking and large institutional clients in over 30 countries in his career as an economist. Mr. Brusca was a Divisional Research Chief at the Federal Reserve Bank of NY (Chief of the International Financial markets Division), a Fed Watcher at Irving Trust and Chief Economist at Nikko Securities International. He is widely quoted and appears in various media. Mr. Brusca holds an MA and Ph.D. in economics from Michigan State University and a BA in Economics from the University of Michigan. His research pursues his strong interests in non aligned policy economics as well as international economics. FAO Economics’ research targets investors to assist them in making better investment decisions in stocks, bonds and in a variety of international assets. The company does not manage money and has no conflicts in giving economic advice.
More Economy in Brief


