 Global| Aug 17 2004
CPI Falls 0.1% in July; "Core" Also Weak
Summary
The Consumer Price Index (CPI-U) fell 0.1% in July versus Consensus expectations for a 0.1-0.2% rise. As last month, the surprise was fueled by energy prices, which dropped 1.9% after July's 2.6% surge. Seasonally adjusted gasoline [...]
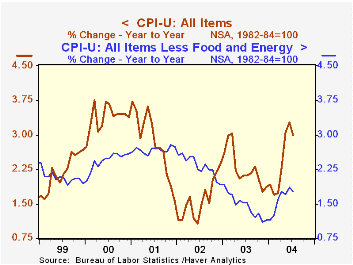
The Consumer Price Index (CPI-U) fell 0.1% in July versus Consensus expectations for a 0.1-0.2% rise. As last month, the surprise was fueled by energy prices, which dropped 1.9% after July's 2.6% surge.
Seasonally adjusted gasoline prices fell back 4.2%, carrying them also below their May level, though still well higher than any previous period.
Core consumer prices again rose less than expected, at 0.1% versus a 0.2% forecast. A variety of prices fell outright, including household furnishings and operations, -0.3%, apparel, a sizable 0.8%, and recreation, -0.2%; medical commodities were off just slightly.
In the other direction, health care services and education tuition and fees continued their long-standing uptrends; school books and supplies, however, edged down 0.1%.
The chained CPI, which adjusts for shifts in the mix of consumer purchases, edged down 0.1%. It is similar to the PCE price deflator. The core chain price measure was again unchanged; it has not risen since April.
| Consumer Price Index | July | June | Y/Y | 2003 | 2002 | 2001 |
|---|---|---|---|---|---|---|
| Total | -0.1% | 0.3% | 3.0% | 2.3% | 1.6% | 2.8% |
| Total less Food & Energy | 0.1% | 0.1% | 1.8% | 1.5% | 2.3% | 2.7% |
| Goods less Food & Energy | -0.3% | 0.0% | -1.2% | -2.0% | -1.1% | 0.3% |
| Services less Energy | 0.3% | 0.2% | 3.0% | 2.9% | 3.8% | 3.7% |
| Energy | -1.9% | 2.6% | 14.3% | 12.2% | -5.8% | 3.7% |
| Food | 0.3% | 0.2% | 4.0% | 2.1% | 1.8% | 3.1% |
| Chained CPI: Total (NSA) | -0.1% | 0.3% | 2.4% | 1.9% | 1.3% | 2.3% |
| Total less Food & Energy | 0.0% | 0.0% | 1.3% | 1.1% | 1.9% | 2.0% |
by Carol Stone August 17, 2004
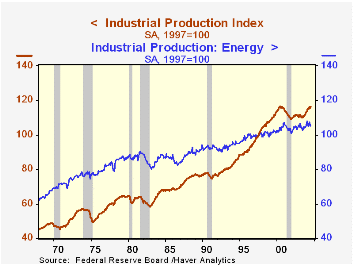
Industrial production recovered in July after its June fall. However, the 0.4% gain was less than the 0.5% market forecasters had looked for, and June itself was revised lower, from a 0.3% decline to a 0.5% decline.
The hints of softness in the production data are concentrated in utilities. Mild weather yielded a 2.5% fall in utility output in June and another 2.1% in July. Production in the important factory sector rebounded 0.6% last month after a 0.2% fall in June.
Output of motor vehicles stabilized after following sizable declines in May and June. The high tech sector continued to expand with some vigor; relatively slower growth occurred in March and April, 1.3% and 1.5%, respectively, but the last three months have averaged 2.5% each. Accompanying the lower utility output, energy producers saw their output reduced by 0.6% after a 1.7% drop in June. Other industries' (excluding energy, motor vehicles and high tech) production moderated in July to a 0.3% rise from 0.4% in June. It is evident visually in the graph that US industry has become more economical in its use of energy. Over the 37-year history of the energy data, that output has increased at a 1.5% annualized rate, as total industry has expanded at a 2.7% pace, a "productivity" difference of 1.2 percentage points. However, over the last 15 years, energy output has been slower, at 1.1%, even as total industrial output has picked up to a 2.9% rate, reflecting a larger "productivity" of 1.8 percentage points.
Total capacity utilization increased to 77.1%, although the downward revision to June means that the July increase leaves utilization still below the 77.2% originally calculated for June. Growth in capacity continued at 1.3% y/y.
| Production & Capacity | July | June | Y/Y | 2003 | 2002 | 2001 |
|---|---|---|---|---|---|---|
| Industrial Production | 0.4% | -0.5% | 4.9% | 0.3% | -0.6% | -3.4% |
| Capacity Utilization | 77.1% | 76.9% | 74.5%(7/03) | 74.8% | 75.6% | 77.4% |
by Carol Stone August 17, 2004
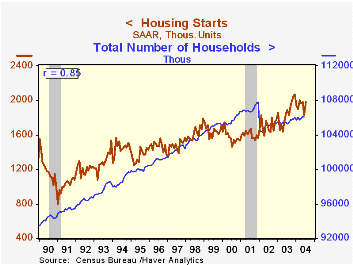
Housing starts jumped 8.3% last month to 1.978M, almost exactly offsetting their June decline of 7.7% (revised from the initial report of 8.5%). Forecasters anticipated some of the rebound, having projected a 1.89 M total.
Single-family starts advanced 8.5%, more than countering June's 8.0% fall, an amount which now reflects an upward revision of the originally reported lower June volume.
Multi-family starts regained 7.6%, breaking a three-month string of declines.
Housing starts rose in every major region of the country, with the largest percentage increases in the West, 15.8%, and the Northeast, 15.7%.
Building permits were up 5.7% m/m.
| Housing Starts (000s, AR) | July | June | Y/Y | 2003 | 2002 | 2001 |
|---|---|---|---|---|---|---|
| Total | 1,978 | 1,826 | -3.5% | 1,848 | 1,705 | 1,601 |
| Single-family | 1,651 | 1,522 | 6.3% | 1,499 | 1,358 | 1,272 |
| Multi-family | 327 | 304 | -8.8% | 349 | 347 | 330 |
| Building Permits | 2,055 | 1945 | 4.3% | 1,831 | 1,748 | 1,637 |
Carol Stone, CBE
AuthorMore in Author Profile »Carol Stone, CBE came to Haver Analytics in 2003 following more than 35 years as a financial market economist at major Wall Street financial institutions, most especially Merrill Lynch and Nomura Securities. She had broad experience in analysis and forecasting of flow-of-funds accounts, the federal budget and Federal Reserve operations. At Nomura Securities, among other duties, she developed various indicator forecasting tools and edited a daily global publication produced in London and New York for readers in Tokyo. At Haver Analytics, Carol was a member of the Research Department, aiding database managers with research and documentation efforts, as well as posting commentary on select economic reports. In addition, she conducted Ways-of-the-World, a blog on economic issues for an Episcopal-Church-affiliated website, The Geranium Farm. During her career, Carol served as an officer of the Money Marketeers and the Downtown Economists Club. She had a PhD from NYU's Stern School of Business. She lived in Brooklyn, New York, and had a weekend home on Long Island.
More Economy in Brief


