 Global| Nov 17 2004
Consumer Prices Strong
by:Tom Moeller
|in:Economy in Brief
Summary
The Consumer Price Index (CPI-U) jumped 0.6% last month, the strongest increase since May. The gain easily beat Consensus forecasts for a 0.4% rise. The 0.2% gain in prices less food and energy just beat the Consensus forecast for a [...]
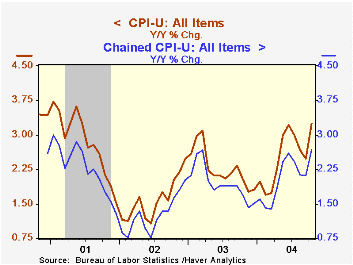
The Consumer Price Index (CPI-U) jumped 0.6% last month, the strongest increase since May. The gain easily beat Consensus forecasts for a 0.4% rise. The 0.2% gain in prices less food and energy just beat the Consensus forecast for a 0.1% rise.
Gasoline prices jumped 8.6% (26.6% y/y) last month but so far in November have not risen further. Fuel oil prices also were strong and surged 8.1% (35.0% y/y). Natural gas prices fell for the second month (+3.1% y/y).
"Core" commodities prices again rose and the 0.4% gain was driven by a 1.0% (0.8% y/y) rise in household furnishings & operation. New motor vehicle prices also increased for the first month in four, up 0.4% (-0.5% y/y) and apparel prices rose 0.2% (-0.7% y/y) .
The increase in services prices less energy eased a bit to 0.2% as the gain in shelter prices fell to just 0.1% (2.8% y/y). Health care services rose 0.4% (5.1% y/y) and tuition & child care costs rose 0.4% (6.8% y/y). Public transportation prices rose 1.4% (-2.3% y/y) after two months of decline.
The chained CPI, which adjusts for shifts in the mix of consumer purchases rose 0.5%. Similar to the PCE price deflator, core chain prices rose 0.4% for the second consecutive month.
"Labor Markets, Energy Prices, and the Outlook for 2005" from Michael H. Moskow, President & CEO
of the Federal Reserve Bank of Chicago are available here.
| Consumer Price Index | Oct | Sept | Y/Y | 2003 | 2002 | 2001 |
|---|---|---|---|---|---|---|
| Total | 0.6% | 0.2% | 3.2% | 2.3% | 1.6% | 2.8% |
| Total less Food & Energy | 0.2% | 0.3% | 2.0% | 1.5% | 2.3% | 2.7% |
| Goods less Food & Energy | 0.4% | 0.2% | 0.1% | -2.0% | -1.1% | 0.3% |
| Services less Energy | 0.2% | 0.3% | 2.8% | 2.9% | 3.8% | 3.7% |
| Energy | 4.2% | -0.4% | 15.2% | 12.2% | -5.8% | 3.7% |
| Food | 0.6% | 0.0% | 3.5% | 2.1% | 1.8% | 3.1% |
| Chained CPI: Total (NSA) | 0.5% | 0.3% | 2.7% | 1.9% | 1.3% | 2.3% |
| Total less Food & Energy | 0.4% | 0.4% | 1.7% | 1.1% | 1.9% | 2.0% |
by Tom Moeller November 17, 2004
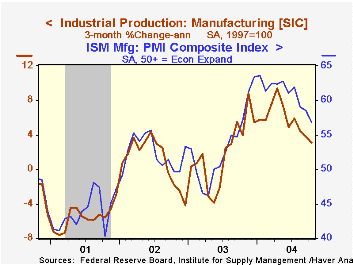
Industrial production rose a firm 0.7% following a downwardly revised 0.1% rise the prior month. Consensus expectations had been for a 0.4% increase in October.
Production in the factory sector jumped 0.8% (6.0% y/y) after the unrevised 0.3% decline the prior month.
Motor vehicles output recovered 2.3% (2.8% y/y) following the prior month's decline. Furniture output also recovered 0.9% (2.0% y/y) after two down months and textile output rose 0.8% (-2.2% y/y). High tech sector output again was firm with a 0.9% (18.8% y/y) rise.
Factory sector output excluding motor vehicles & high tech rose 0.5% (+5.3% y/y).
Total capacity utilization rose to 77.7% as capacity grew 1.5% y/y.
| Production & Capacity | Oct | Sept | Y/Y | 2003 | 2002 | 2001 |
|---|---|---|---|---|---|---|
| Industrial Production | 0.7% | 0.1% | 5.2% | 0.3% | -0.6% | -3.4% |
| Capacity Utilization | 77.7% | 77.3% | 75.0%(11/03) | 74.8% | 75.6% | 77.4% |
by Tom Moeller November 17, 2004
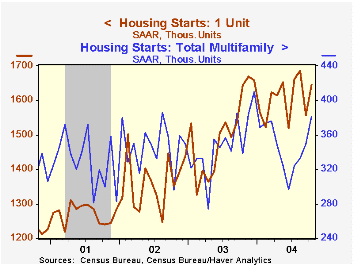
In October, housing starts rose 6.4% to 2.027M, the highest level of the year.Consensus expectations had been for 1.96M starts.
Single-family starts recouped nearly all of the prior month's decline with a 5.7% gain. Year to date single family starts averaged 1.605M, up 6.6% from last year's full year average. Multi-family starts rose 9.5% and the year to date average equals last year.
Building permits fell 0.7% m/m to 1.984M. 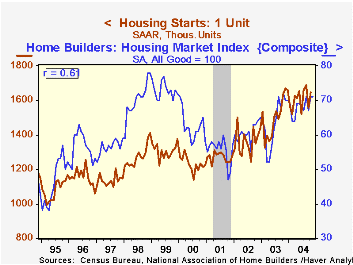
The Composite Housing Market Index from the National Association of Home Builders (NAHB) was stable in November t the downwardly revised October level of 71.
The NAHB index is a diffusion index based on a survey of builders. Readings above 50 signal that more builders view conditions as good than poor.
The index of current single family home sales also surged to its highest in a year and the index of expected sales in six months jumped the highest level since 1999.
During the last ten years there has been a 60% correlation between the level of single family housing starts and the NAHB Index.
| Housing Starts (000s, AR) | Oct | Sept | Y/Y | 2003 | 2002 | 2001 |
|---|---|---|---|---|---|---|
| Total | 2,027 | 1,905 | 2.2% | 1,8 53 | 1,7 10 | 1,601 |
| Single-family | 1,645 | 1,556 | 0.1% | 1,505 | 1,3 63 | 1,272 |
| Multi-family | 3 82 | 349 | 12.7% | 348 | 347 | 330 |
| Building Permits | 1,984 | 1 ,998 | -1.5% | 1,8 89 | 1,749 | 1,637 |
| Nat'l Association of Home Builders | Nov | Oct | Nov '03 | 2003 | 2002 | 2001 |
| Composite Housing Market Index | 7 1 | 71 | 7 0 | 64 | 61 | 56 |
by Tom Moeller November 17, 2004
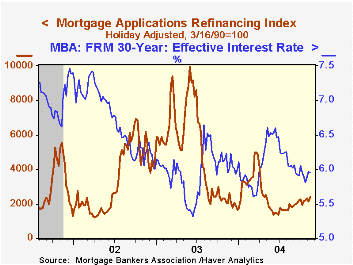
Mortgage applications rose 4.3% last week and reversed nearly all of the prior week's decline, according to the Mortgage Bankers Association (MBA).
Applications to refinance jumped 10.7%, up 74.3% from the early June low.
Purchase applications slipped for the second week but a late month jump lifted the November average so far 5.0% versus October. During the last ten years there has been a 60% correlation between the y/y change in purchase applications and the change in new plus existing home sales.
The effective interest rate on a conventional 30-year mortgage was about stable at 5.95%. It averaged 5.92% in October. The effective rate on a 15-year mortgage also was about stable at 5.40%.
The Mortgage Bankers Association surveys between 20 to 35 of the top lenders in the U.S. housing industry to derive its refinance, purchase and market indexes. The weekly survey accounts for more than 40% of all applications processed each week by mortgage lenders. Visit the Mortgage Bankers Association site here.
| MBA Mortgage Applications (3/16/90=100) | 11/12/04 | 11/05/04 | Y/Y | 2003 | 2002 | 2001 |
|---|---|---|---|---|---|---|
| Total Market Index | 758.3 | 727.3 | 14.3% | 1,067.9 | 799.7 | 625.6 |
| Purchase | 480.3 | 483.0 | 12.8% | 395.1 | 354.7 | 304.9 |
| Refinancing | 2,375.4 | 2,148.7 | 16.2% | 4,981.8 | 3,388.0 | 2,491.0 |

Tom Moeller
AuthorMore in Author Profile »Prior to joining Haver Analytics in 2000, Mr. Moeller worked as the Economist at Chancellor Capital Management from 1985 to 1999. There, he developed comprehensive economic forecasts and interpreted economic data for equity and fixed income portfolio managers. Also at Chancellor, Mr. Moeller worked as an equity analyst and was responsible for researching and rating companies in the economically sensitive automobile and housing industries for investment in Chancellor’s equity portfolio. Prior to joining Chancellor, Mr. Moeller was an Economist at Citibank from 1979 to 1984. He also analyzed pricing behavior in the metals industry for the Council on Wage and Price Stability in Washington, D.C. In 1999, Mr. Moeller received the award for most accurate forecast from the Forecasters' Club of New York. From 1990 to 1992 he was President of the New York Association for Business Economists. Mr. Moeller earned an M.B.A. in Finance from Fordham University, where he graduated in 1987. He holds a Bachelor of Arts in Economics from George Washington University.
More Economy in Brief


