 Global| Oct 19 2004
Consumer Prices Rose Moderately: Used Car Prices Firm
by:Tom Moeller
|in:Economy in Brief
Summary
The Consumer Price Index (CPI-U) rose 0.2% last month. The gain matched Consensus forecasts, but the 0.3% rise in prices less food and energy exceeded the 0.2% expectation. The CPI for "core" commodities rose for the first month in [...]
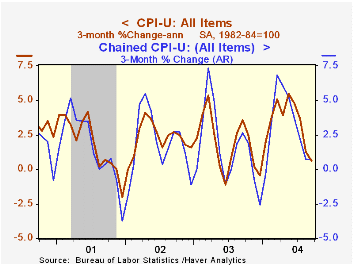
The Consumer Price Index (CPI-U) rose 0.2% last month. The gain matched Consensus forecasts, but the 0.3% rise in prices less food and energy exceeded the 0.2% expectation.
The CPI for "core" commodities rose for the first month in three, up 0.2%. The increase wholly reflected a rise in used motor vehicle prices. New vehicle prices fell 0.2% (-1.1% y/y). Household furnishings & operations prices were unchanged (-0.2% y/y) as were apparel prices (-0.7% y/y).
Services prices less energy rose a moderate 0.3%. Shelter prices, up 0.4% (3.0% y/y), health care services, up 0.3% (5.0% y/y), and education & communication prices, up 0.4% (1.7% y/y) all were relatively firm. Public transportation prices fell 1.1% (-2.8% y/y), the second consecutive down month.
Gasoline prices last month ticked up a modest 0.1% (+9.4% y/y) but in October have risen another 6.4% on average and were $2.04/gallon last week. Fuel oil prices were strong again with a 1.9% (23.9% y/y) rise. Natural gas prices fell 1.0% (+3.0% y/y) though they have recouped all of that decline in October.
The chained CPI, which adjusts for shifts in the mix of consumer purchases rose a firm 0.3%. It is similar to the PCE price deflator. The core chain price measure rose for the first time since April.
| Consumer Price Index | Sept | Aug | Y/Y | 2003 | 2002 | 2001 |
|---|---|---|---|---|---|---|
| Total | 0.2% | 0.1% | 2.5% | 2.3% | 1.6% | 2.8% |
| Total less Food & Energy | 0.3% | 0.1% | 2.0% | 1.5% | 2.3% | 2.7% |
| Goods less Food & Energy | 0.2% | -0.1% | -0.5% | -2.0% | -1.1% | 0.3% |
| Services less Energy | 0.3% | 0.1% | 3.0% | 2.9% | 3.8% | 3.7% |
| Energy | -0.4% | -0.3% | 6.7% | 12.2% | -5.8% | 3.7% |
| Food | 0.0% | 0.1% | 3.4% | 2.1% | 1.8% | 3.1% |
| Chained CPI: Total (NSA) | 0.3% | 0.0% | 2.1% | 1.9% | 1.3% | 2.3% |
| Total less Food & Energy | 0.4% | 0.0% | 1.6% | 1.1% | 1.9% | 2.0% |
by Tom Moeller October 19, 2004
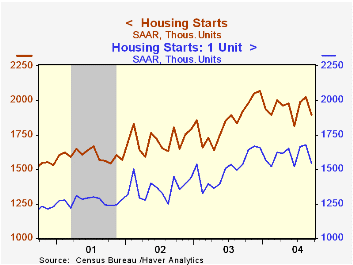
Housing starts fell 6.0% last month to 1.898M following an upwardly revised 1.8% August rise.Consensus expectations had been for 1.95M starts in September.
Single-family starts fell a sharp 8.2% m/m. but the year to date single family average 6.2% above last year. Multi-family starts rose 4.7% following an upwardly revised 5.6% August gain.
Housing starts in the Northeast fell a hard 26.9% (-21.0% y/y) and were off m/m throughout the rest on the country
Building permits rose 1.8% m/m and gained back some of the prior month's 4.7% decline.
"House Prices and Fundamental Value" from the Federal Reserve Bank of San Francisco can be found here.
| Housing Starts (000s, AR) | Sept | Aug | Y/Y | 2003 | 2002 | 2001 |
|---|---|---|---|---|---|---|
| Total | 1,898 | 2,020 | -1.2% | 1,853 | 1,710 | 1,601 |
| Single-family | 1,540 | 1,678 | 0.2% | 1,505 | 1,363 | 1,272 |
| Multi-family | 358 | 342 | -7.0% | 348 | 347 | 330 |
| Building Permits | 2,005 | 1,969 | 3.2% | 1,889 | 1,749 | 1,637 |
by Tom Moeller October 19, 2004
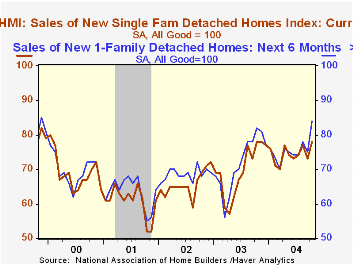
The Composite Housing Market Index from the National Association of Home Builders (NAHB) recovered in October from the prior month's decline to 72, the highest level in a year.
The NAHB index is a diffusion index based on a survey of builders. Readings above 50 signal that more builders view conditions as good than poor.
The index of current single family home sales also surged to its highest in a year and the index of expected sales in six months jumped the highest level since 1999.
The index of traffic of prospective buyers rose to 54 and that was above the year to date average.
Visit the National Association of Home Builders using this link.
| Nat'l Association of Home Builders | Oct | Sept | Oct '03 | 2003 | 2002 | 2001 |
|---|---|---|---|---|---|---|
| Composite Housing Market Index | 72 | 67 | 72 | 64 | 61 | 56 |
by Tom Moeller October 19, 2004
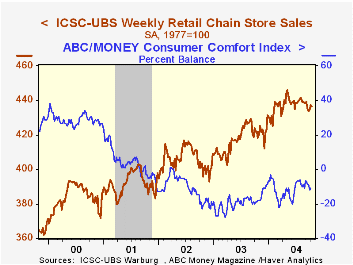
Chain store sales slipped 0.2% last week after two weeks of respectable gain, according to the International Council of Shopping Centers (ICSC)-UBS.
The decline dropped sales so far in October 0.1% below the September average which, battered by Hurricanes, fell 0.7% versusAugust.
During the last ten years there has been a 60% correlation between y/y change in chain store sales and the change in non-auto retail sales less gasoline.
The ICSC-UBS retail chain-store sales index is constructed using the same-store sales reported by 78 stores of seven retailers: Dayton Hudson, Federated, Kmart, May, J.C. Penney, Sears and Wal-Mart.
| ICSC-UBS (SA, 1977=100) | 10/16/04 | 10/09/04 | Y/Y | 2003 | 2002 | 2001 |
|---|---|---|---|---|---|---|
| Total Weekly Retail Chain Store Sales | 436.4 | 437.3 | 3.4% | 2.9% | 3.6% | 2.1% |

Tom Moeller
AuthorMore in Author Profile »Prior to joining Haver Analytics in 2000, Mr. Moeller worked as the Economist at Chancellor Capital Management from 1985 to 1999. There, he developed comprehensive economic forecasts and interpreted economic data for equity and fixed income portfolio managers. Also at Chancellor, Mr. Moeller worked as an equity analyst and was responsible for researching and rating companies in the economically sensitive automobile and housing industries for investment in Chancellor’s equity portfolio. Prior to joining Chancellor, Mr. Moeller was an Economist at Citibank from 1979 to 1984. He also analyzed pricing behavior in the metals industry for the Council on Wage and Price Stability in Washington, D.C. In 1999, Mr. Moeller received the award for most accurate forecast from the Forecasters' Club of New York. From 1990 to 1992 he was President of the New York Association for Business Economists. Mr. Moeller earned an M.B.A. in Finance from Fordham University, where he graduated in 1987. He holds a Bachelor of Arts in Economics from George Washington University.
More Economy in Brief


