 Global| Aug 10 2009
Consumer Debt Deleveraging Continues At A Record Pace
by:Tom Moeller
|in:Economy in Brief
Summary
Consumers' near-term worry is about the poor shape of the U.S. economy and what, for many, are balance sheets loaded with too much debt. The longer-term situation is that the consumer spending cycle has passed its peak and is now [...]
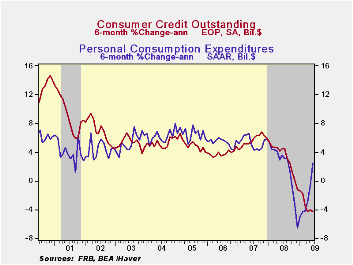
Consumers' near-term worry is about the poor shape of the U.S. economy and what, for many, are balance sheets loaded with too much debt. The longer-term situation is that the consumer spending cycle has passed its peak and is now being damped by an aging population. Together, these forces are causing individuals to shed debt at a record rate. The Federal Reserve reported late Friday that consumer credit outstanding during June fell for the fifth straight month and for the ninth month since last summer. The $10.3B decline followed a slightly-revised $5.4B May drop and it reduced consumer debt by a record 2.8% year-to-year. Since December that rate has accelerated to 4.3%.
Usage of revolving credit again fell sharply. The 5.3B m/m
decline followed a $4.8B drop during May. The latest was the ninth
decline in as many months. It lowered usage by 5.1% versus one year ago
and at an 8.3% rate so far this year. 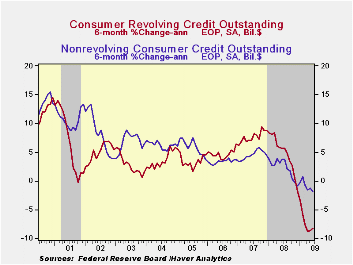
Separately, the Fed reported that non-revolving credit (autos & other consumer durables), which accounts for nearly two-thirds of the total, fell a similarly hard $5.1B in June. Compared to the decline in revolving credit usage, the drop here has been less dramatic, but still substantial. The 1.4% y/y shortfall compares to a 6.8% drop after the 1990-91 recession. It is similar to the pullbacks during 1975 and even the "credit crunch" recession of 1980. During the last six months non-revolving consumer credit has fallen at a 1.9% annual rate.
These figures are the major input to the Fed's quarterly Flow of Funds accounts for the household sector.
Credit data are available in Haver's USECON database. The Flow of Funds data are in Haver's FFUNDS database.
5 Tips for Dealing with a Home Equity Line Freeze or Reduction from the Federal Reserve Board can be found here.
| Consumer Credit (m/m Chg, SAAR) | June | May | Y/Y | 2008 | 2007 | 2006 |
|---|---|---|---|---|---|---|
| Total | $-10.3B | $-5.4B | -2.8% | 1.6% | 5.6% | 4.1% |
| Revolving | $-5.3B | $-4.8B | -5.1% | 1.9% | 7.8% | 5.0% |
| Non-revolving | $-5.1B | $-0.5B | -1.4% | 1.4% | 4.4% | 3.6% |
by Robert Brusca August 10, 2009
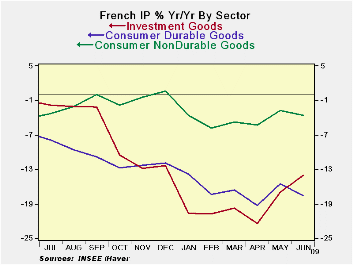
French industrial output in June has expanded by 0.3% m/m
after rising by 2.8% in May, turning the three-month rate of growth
positive. Capital goods and intermediate goods output lead the rise.
The output of consumer goods is still falling over three months
although consumer nondurables output is looking steadier than consumer
durable goods output, which fell sharply in June.
In the completed quarter to date output in France is off by
3.2% at an annual rate. Output in the quarter is stabilized by the
rising output of consumer nondurable goods and capital goods, each of
which rose at a pace of 6.4% in Q2. But consumer durables output is
still falling at a 16.1% annual rate and intermediate goods output
fell, dragging the overall growth rate of production into negative
territory for the quarter.
Auto output is up strongly on auto incentives. Output for the
auto sector is up at a 266% annual rate over three months and at a 47%
annual rate in the quarter, helping to buoy the economy.
On balance the French figures are offering very hopefuls signs
of stabilization in the sector. Europe is trying to find its footing
and France is part of the solution.
| French IP Excluding Construction | |||||||
|---|---|---|---|---|---|---|---|
| Saar exept m/m | Jun-09 | May-09 | Apr-09 | 3-mo | 6-mo | 12-mo | Quarter-to-date |
| IP total | 0.3% | 2.8% | -1.4% | 7.2% | -10.0% | -12.8% | -3.2% |
| Consumer Dur | -2.7% | 0.9% | -2.3% | -15.1% | -18.6% | -17.6% | -16.1% |
| Consumer Ndur | 0.0% | 0.2% | -0.5% | -1.2% | -12.3% | -3.7% | 6.4% |
| Capital | 1.3% | 2.7% | -0.1% | 16.4% | -10.7% | -14.1% | 6.4% |
| Intermed | -0.3% | 3.7% | -0.4% | 12.6% | -8.4% | -21.6% | -0.7% |
| Memo | |||||||
| Auto | 14.5% | 11.3% | 8.6% | 266.7% | 41.9% | -24.3% | 47.3% |
by Louise Curley August 10, 2009
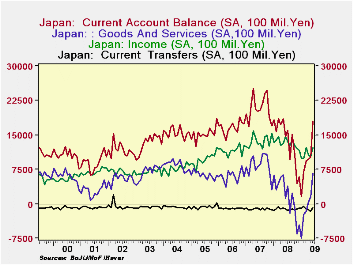 Japan's
Current Account increased sharply, outpacing expectations, in June to
1,799 billion yen from 1, 016 billion Yen in May. It was
moreover, the fifth successive month of increase and the year
over year change is now above the year ago figure for the first time
since November, 2007. The first chart shows the current
account and its major components--Goods and Services, Income and
Current Transfers. (The Chart shows the data in 100 millions of Yen,
while the table below and text figures are in billions of Yen.)
Japan's
Current Account increased sharply, outpacing expectations, in June to
1,799 billion yen from 1, 016 billion Yen in May. It was
moreover, the fifth successive month of increase and the year
over year change is now above the year ago figure for the first time
since November, 2007. The first chart shows the current
account and its major components--Goods and Services, Income and
Current Transfers. (The Chart shows the data in 100 millions of Yen,
while the table below and text figures are in billions of Yen.)
The
balance of Trade in Goods and Services accounted for the largest part
of the June increase in the current account balance. 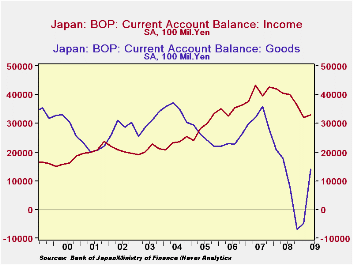 The
positive balance on goods increased by 333 billion Yen while the
negative balance on services decreased by 172 billion Yen, resulting in
a 505 billion yen improvement in the balance on Goods and Services.
The
positive balance on goods increased by 333 billion Yen while the
negative balance on services decreased by 172 billion Yen, resulting in
a 505 billion yen improvement in the balance on Goods and Services.
The balance on Income has become more important than the
balance on
Goods in the Current Account Balance since the second quarter of 2005
as can be seen in the second chart. This reflects the growth
of Japan's net international investment position as Japans direct and
portfolio investments abroad have generally exceeded foreign direct and
portfolio investments in Japan. The third chart shows Japan's
net international investment position. 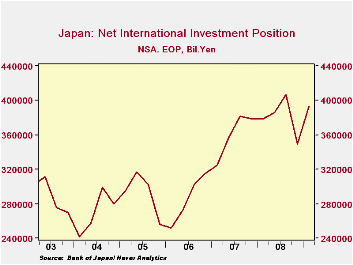 The June increase in Income was
200 billion yen, smaller than the goods contribution, but the actual
balance of 1,219 billion Yen remains well above the goods balance of
735 billion Yen. The decline in the income balance of 244
billion Yen from a year ago is due largely to the decline in returns on
portfolio investments.
The June increase in Income was
200 billion yen, smaller than the goods contribution, but the actual
balance of 1,219 billion Yen remains well above the goods balance of
735 billion Yen. The decline in the income balance of 244
billion Yen from a year ago is due largely to the decline in returns on
portfolio investments.
Finally, the negative balance on current
transfers declined in June by 78 billion yen, also contributing to the
improvement of the current account balance.
| JAPAN | Jun 09 | May 09 | Jun 08 | M/M Dif | Y/Y Dif | 2008 | 2007 | 2006 |
|---|---|---|---|---|---|---|---|---|
| Current Account (SA Bil.Yen) | 1799 | 1016 | 1663 | 783 | 335 | 16425 | 25054 | 19965 |
| Goods and Services | 658 | 153 | 120 | 505 | 538 | 1916 | 10088 | 7250 |
| Goods | 735 | 402 | 347 | 333 | 388 | 4016 | 12564 | 9404 |
| Services | -77 | -249 | -227 | 172 | 150 | -2100 | -2475 | -2154 |
| Income | 1219 | 1019 | 1463 | 200 | -244 | 15876 | 16326 | 13943 |
| Current Transfers | -78 | -156 | -119 | 78 | 41 | -1367 | -1360 | -1233 |

Tom Moeller
AuthorMore in Author Profile »Prior to joining Haver Analytics in 2000, Mr. Moeller worked as the Economist at Chancellor Capital Management from 1985 to 1999. There, he developed comprehensive economic forecasts and interpreted economic data for equity and fixed income portfolio managers. Also at Chancellor, Mr. Moeller worked as an equity analyst and was responsible for researching and rating companies in the economically sensitive automobile and housing industries for investment in Chancellor’s equity portfolio. Prior to joining Chancellor, Mr. Moeller was an Economist at Citibank from 1979 to 1984. He also analyzed pricing behavior in the metals industry for the Council on Wage and Price Stability in Washington, D.C. In 1999, Mr. Moeller received the award for most accurate forecast from the Forecasters' Club of New York. From 1990 to 1992 he was President of the New York Association for Business Economists. Mr. Moeller earned an M.B.A. in Finance from Fordham University, where he graduated in 1987. He holds a Bachelor of Arts in Economics from George Washington University.
More Economy in Brief


