 Global| Aug 30 2005
Consumer Confidence Posted Surprising Increase
by:Tom Moeller
|in:Economy in Brief
Summary
The Conference Board's August index of Consumer Confidence posted a 1.9% m/m increase to 105.6 following a 2.4% July decline that was shallower than initially reported. Consensus expectations had been for a decline to 101.4 in [...]
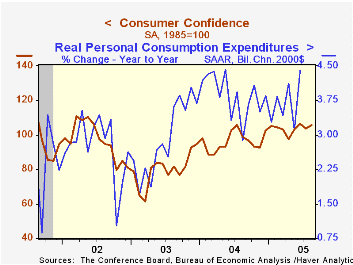
The Conference Board's August index of Consumer Confidence posted a 1.9% m/m increase to 105.6 following a 2.4% July decline that was shallower than initially reported.
Consensus expectations had been for a decline to 101.4 in sympathy with the 7.7% m/m decline in consumer sentiment reported last week by the University of Michigan.
During the last twenty years there has been a 52% correlation between the level of consumer confidence and the y/y change in real consumer spending. The correlation rose to 66% during the last ten years.
Consumers' assessment of the present situation rose 3.6% m/m to the highest level since 2001. Jobs were viewed as hard to get by 23.2% of survey participants, down slightly m/m, but the 29.8% of participants who thought that business conditions were good was a further improvement on earlier strong readings.
Consumer expectations gained back 0.5% (-3.7% y/y) of a sharp 3.3% decline in July.
The Conference Board’s survey isconducted by a mailed questionnaire to 5,000 households and about 3,500 typically respond.
| Conference Board | August | July | Y/Y | 2004 | 2003 | 2002 |
|---|---|---|---|---|---|---|
| Consumer Confidence | 105.6 | 103.6 | 7.0% | 96.1 | 79.8 | 96.6 |
by Tom Moeller August 30, 2005
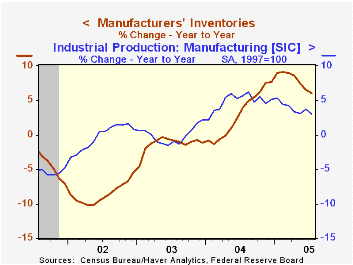
Factory inventories rose 0.5% in July, the most for any one month since February. The rise, however, was very much a function of the 5.9% (19.2% y/y) jump in inventories at petroleum refineries. Nevertheless, less petroleum factory inventories rose 0.2%, the first monthly rise since March. Benchmark revisions made on August 19th extended back to 1992 and generally lowered the level of factory inventories.
A 1.5% (10.2% y/y) rise in machinery inventories led last month's accumulation and it was the strongest monthly gain since January. That was accompanied by a 0.8% (-1.1% y/y) rise in computer inventories and a 0.4% (4.7% y/y) gain in the electrical equipment industry.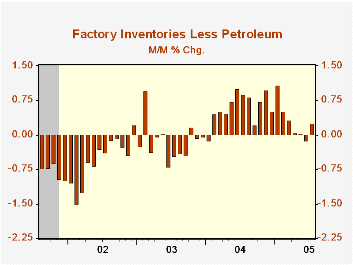
Factory shipments surged 0.7%, but again the strength of the gain reflected higher oil prices. Less a 6.4% jump in shipments from petroleum refineries, factory shipments rose just 0.3% (4.8% y/y) following a 0.3% decline in June. Strength concentrated in the electrical equipment industry where shipments rose 1.0% (5.0% y/y) and in the computer industry where shipments rose 0.4% (8.3% y/y). Machinery shipments fell 0.1% (+4.9% y/y).
Factory sector orders fell 1.9% reflecting an unrevised advance report of a 4.9% decline in durables orders which were down due to lower aircraft orders.
Unfilled orders surged another 1.0% and again reflected higher backlogs of nondefense aircraft & parts (28.4% y/y), but industry gains elsewhere were broad based. The ratio of unfilled orders to shipments outside of transportation dipped slightly but remained elevated versus the lows of earlier this year.
| Factory Survey (NAICS) | July | June | Y/Y | 2004 | 2003 | 2002 |
|---|---|---|---|---|---|---|
| Inventories | 0.5% | 0.1% | 6.0% | 7.7% | -1.1% | -5.4% |
| New Orders | -1.9% | 0.9% | 6.3% | 9.3% | 3.5% | -2.5% |
| Shipments | 0.7% | 0.0% | 6.6% | 9.5% | 1.5% | -2.5% |
| Unfilled Orders | 1.0% | 2.8% | 8.9% | 8.4% | 8.0% | -8.5% |
by Tom Moeller August 30, 2005
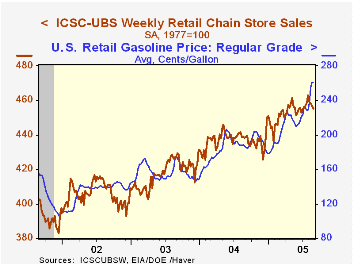
Chain store sales fell again according to the International Council of Shopping Centers (ICSC)-UBS survey. Last week's 0.3% decline marked the fourth consecutive weekly skid and dropped the August sales average 0.1% below July which rose 0.8% from June.
During the last ten years there has been a 56% correlation between the y/y change in chain store sales and the change in non-auto retail sales less gasoline, as published by the US Census Department. Chain store sales correspond directly with roughly 14% of non-auto retail sales less gasoline. Recent weakness in chain store sales has accompanied the spurt in gasoline prices. Last week, gasoline prices were about stable w/w at $2.61 per gallon, a level up 46% since the start of this year. The spot price of gasoline this week is up another 10% w/w. The leading indicator of chain store sales from ICSC gave back half of the prior week's rise. The indicator's recent erratic movement has left the August average 0.3% below July which fell 0.4% from June. The ICSC-UBS retail chain-store sales index is constructed using the same-store sales (stores open for one year) reported by 78 stores of seven retailers: Dayton Hudson, Federated, Kmart, May, J.C. Penney, Sears and Wal-Mart.Reflections on central banking, remarks by Federal Reserve Chairman Alan Greenspan, are available here.
| ICSC-UBS (SA, 1977=100) | 08/27/05 | 08/20/05 | Y/Y | 2004 | 2003 |
|---|---|---|---|---|---|
| Total Weekly Chain Store Sales | 455.5 | 456.8 | 3.9% | 4.6% | 2.9% |

Tom Moeller
AuthorMore in Author Profile »Prior to joining Haver Analytics in 2000, Mr. Moeller worked as the Economist at Chancellor Capital Management from 1985 to 1999. There, he developed comprehensive economic forecasts and interpreted economic data for equity and fixed income portfolio managers. Also at Chancellor, Mr. Moeller worked as an equity analyst and was responsible for researching and rating companies in the economically sensitive automobile and housing industries for investment in Chancellor’s equity portfolio. Prior to joining Chancellor, Mr. Moeller was an Economist at Citibank from 1979 to 1984. He also analyzed pricing behavior in the metals industry for the Council on Wage and Price Stability in Washington, D.C. In 1999, Mr. Moeller received the award for most accurate forecast from the Forecasters' Club of New York. From 1990 to 1992 he was President of the New York Association for Business Economists. Mr. Moeller earned an M.B.A. in Finance from Fordham University, where he graduated in 1987. He holds a Bachelor of Arts in Economics from George Washington University.
More Economy in Brief


