 Global| Sep 27 2005
Consumer Confidence Down Sharply
by:Tom Moeller
|in:Economy in Brief
Summary
The Conference Board's September index of Consumer Confidence fell 17.9% m/m to 86.6 following a 1.8% gain during August that was little revised. Consensus expectations had been for a shallower decline to 94.7. Last week, the [...]
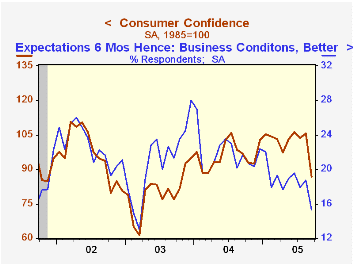
The Conference Board's September index of Consumer Confidence fell 17.9% m/m to 86.6 following a 1.8% gain during August that was little revised.
Consensus expectations had been for a shallower decline to 94.7. Last week, the University of Michigan reported that its measure of consumer sentiment fell 13.7% m/m (-18.4% y/y).
During the last twenty years there has been a 52% correlation between the level of consumer confidence and the y/y change in real consumer spending. The correlation rose to 66% during the last ten years.
The index of consumers' expectations fell 23.2% m/m (-26.6% y/y) while the assessment of the present situation dropped 12.0% (+14.3% y/y). Jobs were viewed as hard to get by 25.4% of survey participants, a rise to the highest level this year though the 25.2% of participants who thought that business conditions were good was the lowest since February.
The Conference Board’s survey isconducted by a mailed questionnaire to 5,000 households and about 3,500 typically respond.
| Conference Board | Sept | August | Y/Y | 2004 | 2003 | 2002 |
|---|---|---|---|---|---|---|
| Consumer Confidence | 86.6 | 105.5 | -10.4% | 96.1 | 79.8 | 96.6 |
by Tom Moeller September 27, 2005
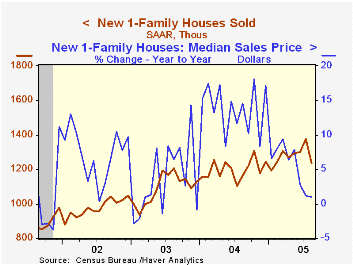
New single-family home sales dropped 9.9% m/m last month to 1.237M following a 5.3% gain in July that was slightly weaker than estimated initially. Consensus expectations had been for stability in August near 1.35M.
The latest decline reflected widespread, sharp declines of 22.0% (+16.4% y/y) in the Northeast, 10.6% (-10.6% y/y) in the Midwest and 17.9% (+3.9% y/y) out West. Sales in the South managed to fall only 2.2% (+13.1% y/y).
With a 2.5% rise, the median price of a new single family home reversed most of the prior month's revised 3.0% decline which was half the decline reported initially.
The figures from the Census Department reflect home sales counted at the time of sales contract or deposit.
Yesterday's speech by Federal Reserve Board Chairman Alan Greenspan titled Mortgage Banking can be found here.
Estimates of Home Mortgage Originations, Repayments, and Debt on One-to-Four-Family Residences by Alan Greenspan and James Kennedy is available here.
| Homes Sales (000s, AR) | Aug | July | Y/Y | 2004 | 2003 | 2002 |
|---|---|---|---|---|---|---|
| New Single-Family | 1,237 | 1,373 | 6.2% | 1,200 | 1,091 | 976 |
by Tom Moeller September 27, 2005

The International Council of Shopping Centers (ICSC)-UBS survey indicated that chain store sales inched 0.1% higher last week, depressed again by the Hurricane effect which lowered sales 2.1% the prior week. So far this month sales are 1.6% below the August average which fell 0.1% from July.
During the last ten years there has been a 56% correlation between the y/y change in chain store sales and the change in non-auto retail sales less gasoline, as published by the US Census Department. Chain store sales correspond directly with roughly 14% of non-auto retail sales less gasoline. The weak rise in sales last week accompanied a slight 0.6% up tick in gasoline prices to $2.80 per gallon (46.2% y/y). The leading indicator of chain store sales from ICSC fell another 0.5% (-2.9% y/y) after the 2.0% decline the prior week and it was the fourth decline in the last five weeks.The ICSC-UBS retail chain-store sales index is constructed using the same-store sales (stores open for one year) reported by 78 stores of seven retailers: Dayton Hudson, Federated, Kmart, May, J.C. Penney, Sears and Wal-Mart.
| ICSC-UBS (SA, 1977=100) | 09/24/05 | 09/17/05 | Y/Y | 2004 | 2003 |
|---|---|---|---|---|---|
| Total Weekly Chain Store Sales | 445.5 | 445.0 | 2.8% | 4.6% | 2.9% |
by Louise Curley September 27, 2005
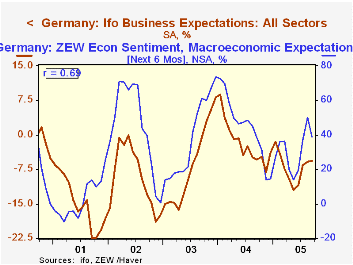
The IFO's overall measure of business confidence in Germany, the Business Climate Index, rose unexpectedly in September to 96.0 (2000=100) from 94.6 in August. Most analysts had expected the index to weaken in view of the spike in energy prices and the indecisive results of the September 18th election. Indeed the I FO reported that the 20 percent of the replies received after the election were more pessimistic than those received earlier. In addition, the ZEW measure of business confidence, published last week, had shown a drop to 38.6% in September in the balance of those expecting conditions to be better in the next six months and those expecting conditions to be worse from 50.0% in August.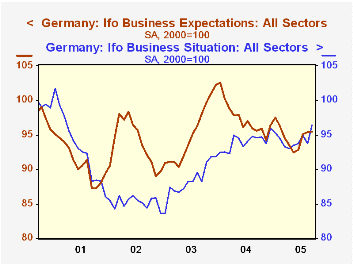
The ZEW measure is frequently a good predictor of the IFO measure, but by no means a sure fire one as indicated by the degree of correlation (R) between the two series, which is 69%. The R-Squared, which measures the degree to which variations in one variable explain variations in the other is only 48%. The first chart shows the ZEW percentage balance between those expecting better conditions in the next six months and those expecting worse conditions and the IFO diffusion index for expectations of conditions six month ahead.
The rise in confidence in the IFO measure was due largely to the respondents' appraisal of current conditions with the index rising 2.77% from 93.8 in August to 96.4 in September. The rise in expectations for the economy six month ahead was only one-tenth of one percent. The indexes of current conditions and expectations of conditions six month ahead are shown in the second chart. Much of the satisfaction with current conditions has been attributed to the decline in the Euro. The Euro averaged around 1.22 to the dollar during the survey period, down from 1.36 at the end of 2004.
| IFO Indexes 2000=100 | Sep 05 | Aug 05 | Sep 04 | M/M % | Y/Y % | 2004 | 2003 | 2002 |
|---|---|---|---|---|---|---|---|---|
| Business Climate | 96.0 | 94.6 | 95.1 | 1.4 | 0.9 | 95.7 | 91.6 | 89.4 |
| Current Conditions | 96.4 | 93.8 | 94.6 | 2.6 | 2.0 | 94.0 | 88.4 | 85.3 |
| Expectations (next 6 months) | 95.5 | 95.4 | 95.6 | 0.1 | -0.1 | 97.4 | 95.1 | 93.9 |
| Expectations (next 6 months) |
DIF | DIF | ||||||
| ZEW (% balance) | 38.6 | 50.0 | 38.6 | -11.4 | 0.0 | 44.6 | 38.4 | 45.3 |
| IFO (diffusion index) | -5.7 | -5.8 | -5.4 | 0.10 | -3.0 | -1.8 | -6.5 | -9.0 |

Tom Moeller
AuthorMore in Author Profile »Prior to joining Haver Analytics in 2000, Mr. Moeller worked as the Economist at Chancellor Capital Management from 1985 to 1999. There, he developed comprehensive economic forecasts and interpreted economic data for equity and fixed income portfolio managers. Also at Chancellor, Mr. Moeller worked as an equity analyst and was responsible for researching and rating companies in the economically sensitive automobile and housing industries for investment in Chancellor’s equity portfolio. Prior to joining Chancellor, Mr. Moeller was an Economist at Citibank from 1979 to 1984. He also analyzed pricing behavior in the metals industry for the Council on Wage and Price Stability in Washington, D.C. In 1999, Mr. Moeller received the award for most accurate forecast from the Forecasters' Club of New York. From 1990 to 1992 he was President of the New York Association for Business Economists. Mr. Moeller earned an M.B.A. in Finance from Fordham University, where he graduated in 1987. He holds a Bachelor of Arts in Economics from George Washington University.
More Economy in Brief


