 Global| Oct 25 2005
Consumer Confidence Down Again
by:Tom Moeller
|in:Economy in Brief
Summary
In October, the Conference Board's index of Consumer Confidence fell to 85.0 and added 2.9% to the 17.9% m/m decline during the prior month. Consensus expectations had been for little change at 88.0. Last week, the University of [...]
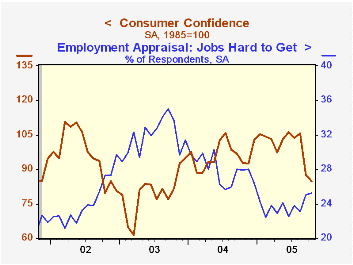
In October, the Conference Board's index of Consumer Confidence fell to 85.0 and added 2.9% to the 17.9% m/m decline during the prior month.
Consensus expectations had been for little change at 88.0. Last week, the University of Michigan reported that its October measure of consumer sentiment fell 2.0% m/m (-17.8% y/y).
During the last twenty years there has been a 52% correlation between the level of consumer confidence and the y/y change in real consumer spending. The correlation rose to 66% during the last ten years.
The index of consumers' expectations fell 3.9% m/m (-24.6% y/y) and the assessment of the present situation slipped 2.0% (+15.1% y/y). Jobs were viewed as hard to get by an increased 25.3% of survey participants.
The Conference Board’s survey isconducted by a mailed questionnaire to 5,000 households and about 3,500 typically respond.
| Conference Board | Oct | Sept | Y/Y | 2004 | 2003 | 2002 |
|---|---|---|---|---|---|---|
| Consumer Confidence | 85.0 | 87.5 | -8.5% | 96.1 | 79.8 | 96.6 |
by Tom Moeller October 25, 2005
The latest release from the National Association of Realtors is available here.
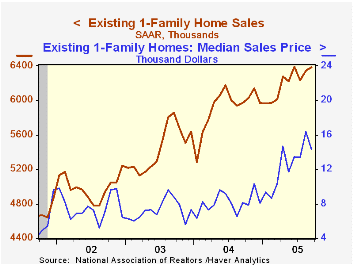
| Existing Home Sales (000, AR) | Sept | Aug | Y/Y | 2004 | 2003 | 2002 |
|---|---|---|---|---|---|---|
| Total Home Sales | 7,280 | 7,280 | 7.2% | 6,723 | 6,170 | 5,653 |
| Single Family Home Sales | 6,380 | 6,340 | 6.9% | 5,913 | 5,441 | 4,995 |
| Single Family Median Home Price ($,000) | $212.2 | $219.7 | 14.3% | $182.8 | $169.1 | $157.6 |
by Tom Moeller October 25, 2005
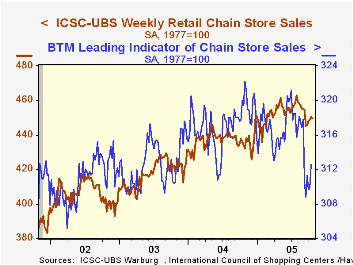
Chain store sales slipped 0.2% last week and reversed half of the prior week's increase, according to the International Council of Shopping Centers (ICSC)-UBS survey. For the month, the level of sales is even with the September average.
During the last ten years there has been a 56% correlation between the y/y change in chain store sales and the change in non-auto retail sales less gasoline, as published by the US Census Department. Chain store sales correspond directly with roughly 14% of non-auto retail sales less gasoline. The leading indicator of chain store sales from ICSC jumped 0.9% (-2.3% y/y) during the latest week but for the month so far is down 0.1% from the September average.The ICSC-UBS retail chain-store sales index is constructed using the same-store sales (stores open for one year) reported by 78 stores of seven retailers: Dayton Hudson, Federated, Kmart, May, J.C. Penney, Sears and Wal-Mart.
| ICSC-UBS (SA, 1977=100) | 10/22/05 | 10/15/05 | Y/Y | 2004 | 2003 |
|---|---|---|---|---|---|
| Total Weekly Chain Store Sales | 449.7 | 450.6 | 3.6% | 4.6% | 2.9% |
by Tom Moeller October 25, 2005
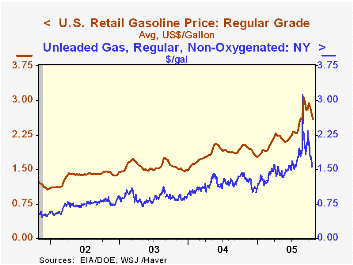
The US average retail gasoline price continued lower last week and fell to $2.60 per gallon from $2.73 during the prior week.
Crude oil prices continued lower as well. WTI crude fell yesterday to $61.13 per barrel versus an average of $62.44 during last week and versus the late August high of $69.82.
Deflation: Making Sure "It" Doesn't Happen Here, a 2002 speech made by Ben S. Bernanke can be found here.
| Energy Prices | 10/24/05 | 12/31/04 | Y/Y | 2004 | 2003 | 2002 |
|---|---|---|---|---|---|---|
| US Retail Gasoline, Regular ($/Gal.) | $2.60 | $1.79 | 28.1% | $1.85 | $1.56 | $1.35 |
| Domestic Spot Market Price: West Texas Intermediate ($/Barrel) | $61.13 | $41.78 | 10.7% | $41.78 | $32.78 | $31.23 |
by Louise Curley October 25, 2005
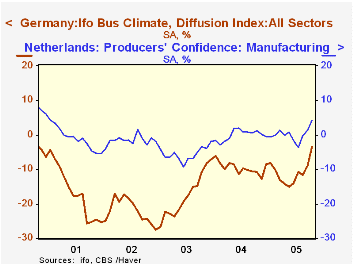
The healthy October rises in German and Dutch measures of business confidence following yesterday's report of continued rising business confidence in France are beginning to suggest a pickup in economic activity within the Euro Zone.
Although the pessimists still outweigh the optimists in Germany, the excess of pessimists declined in October to 3.5% from 8.9% in September according to the IFO measure of confidence. In the Netherlands, the optimists who had exceeded the pessimists in September by 1.3% increased their excess over the pessimists to 4.3% in October. The percent balances of the optimists over the pessimists for both German and Dutch business are shown in the first chart.
In appraising current economic conditions in Germany, businessmen have generally been more pessimistic than optimistic. In the entire history of the IFO confidence data, from January, 1991 to date, the only time when the balance of opinion on current conditions was positive was the period from January 1991 to March 1992 and the month of May 2000.In their expectations of conditions six month ahead, German businessmen have generally been more optimistic, but even here, the times when the optimists outweighed the pessimists have been few and the positive balances small. The second chart shows the history of the IFO's percent balances of opinion of German businessmen for current conditions and expectations of conditions six months ahead. Because of this apparent bias in the IFO data, it is more useful to look at the changes in the data rather than the absolute values. 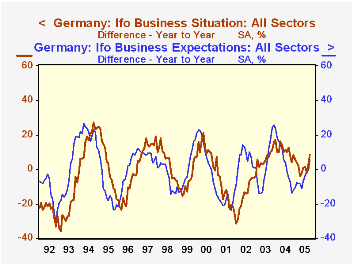
In the third chart we show the year-to-year changes in the appraisals of current conditions and expectations of conditions six month ahead. Here we see a marked increase in confidence in October both in current conditions and expectations for conditions six month ahead.
| Business Confidence Indicators (% Balance) | Oct 05 | Sep 05 | Oct 04 | M/M Dif | Y/Y Dif | 2004 | 2003 | 2002 |
|---|---|---|---|---|---|---|---|---|
| Netherlands | ||||||||
| Producers' Confidence | 4.3 | 1.3 | 1.1 | 3.0 | 3.2 | -0.1 | -5.6 | -1.5 |
| Germany IFO | ||||||||
| Business Climate | -3.5 | -8.9 | -10.7 | 5.4 | 7.2 | -9.6 | -17.6 | -22.0 |
| Business Situation | -7.4 | -12.1 | -16.1 | 4.7 | 8.7 | -17.0 | -27.9 | -34.0 |
| Business Expectations | 0.5 | -5.6 | -5.2 | 6.1 | 5.7 | -1.8 | -6.5 | -9.1 |

Tom Moeller
AuthorMore in Author Profile »Prior to joining Haver Analytics in 2000, Mr. Moeller worked as the Economist at Chancellor Capital Management from 1985 to 1999. There, he developed comprehensive economic forecasts and interpreted economic data for equity and fixed income portfolio managers. Also at Chancellor, Mr. Moeller worked as an equity analyst and was responsible for researching and rating companies in the economically sensitive automobile and housing industries for investment in Chancellor’s equity portfolio. Prior to joining Chancellor, Mr. Moeller was an Economist at Citibank from 1979 to 1984. He also analyzed pricing behavior in the metals industry for the Council on Wage and Price Stability in Washington, D.C. In 1999, Mr. Moeller received the award for most accurate forecast from the Forecasters' Club of New York. From 1990 to 1992 he was President of the New York Association for Business Economists. Mr. Moeller earned an M.B.A. in Finance from Fordham University, where he graduated in 1987. He holds a Bachelor of Arts in Economics from George Washington University.
More Economy in Brief


