 Global| Apr 22 2005
Commodity Prices Meander, Forward Momentum Lost
by:Tom Moeller
|in:Economy in Brief
Summary
The JoC-ECRI (Journal of Commerce-Economic Cycle Research Institute) index of industrial commodity prices has moved somewhat lower during the last few weeks, and that decline highlights the loss of forward momentum developed during [...]
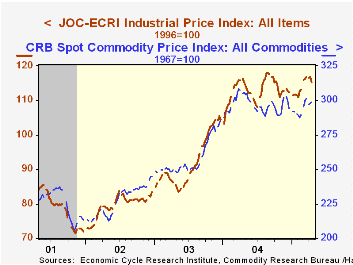
The JoC-ECRI (Journal of Commerce-Economic Cycle Research Institute) index of industrial commodity prices has moved somewhat lower during the last few weeks, and that decline highlights the loss of forward momentum developed during the last year.
The y/y change in industrial commodity prices recently dropped to zero from a high above 30% about a year ago.
Much of that momentum loss is due to lower petroleum prices. The roughly 4% decline of late helped pull the y/y gain down to about 30% versus the doubling as of last November and 50% rate of increase last Spring.
Additionally, metals prices have been moving sideways for the last five months and the y/y rate of increase has fallen to 9% from its high of above 50% one year ago. A recent moderate decline in copper scrap prices pulled the y/y change to 21% versus the high of 60% and steel scrap prices have moved in a similar pattern with the y/y gain falling to 17% versus the high of 125%.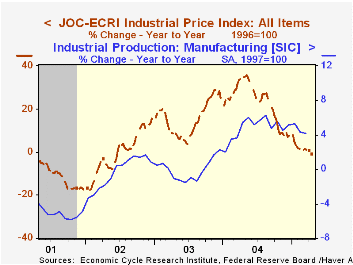
Textile prices have meandered since early March though the y/y gain of zero reflects improvement from negative 9% this past November. Peak y/y growth of 15% was logged in late 2003. In the "miscellaneous" category, lumber prices recently recovered a portion of an earlier decline but remain 12% off the 2004 high.
The CRB (Commodity Research Bureau) commodity price index has moved sideways for over a year. The index differs from the JoC-ECRI version in that roughly half of the weighting reflects agricultural prices. Year to year growth fell negative this past January versus the high of +24% last April. Foodstuffs prices are down 12% from last year's high and livestock prices, though they recovered a bit recently, are flat versus 20% y/y growth this time last year and 40% growth late in 2003.
| JoC-ECRI Industrial Price Index | 04/21/05 | 12/31/04 | Y/Y | 2004 | 2003 | 2002 |
|---|---|---|---|---|---|---|
| All Items | 114.9 | 111.5 | -0.4% | 112.78 | 91.97 | 79.53 |
| Textiles | 67.3 | 64.5 | 0.0% | 65.83 | 65.09 | 59.73 |
| Metals | 126.5 | 123.5 | 10.6% | 118.15 | 84.57 | 75.14 |
| Miscellaneous | 103.1 | 104.3 | -19.4% | 114.03 | 102.89 | 85.81 |
| Petroleum | 249.5 | 217.5 | 33.5% | 207.13 | 135.26 | 110.06 |
| CRB Spot Commodity Price Index | 04/21/05 | 12/31/04 | Y/Y | 2004 | 2003 | 2002 |
| All Commodities | 300.9 | 293.0 | -1.3% | 296.9 | 258.1 | 227.4 |
by Tom Moeller April 22, 2005
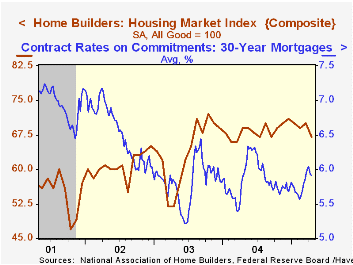
The National Association of Home Builders' (NAHB) Composite Housing Market Index fell to 67 in April versus an upwardly revised 70 in March. The index has fallen in three out of last four months.
All of the index components fell from March's level. The index of current sales is off 6.2% from the December high and the index of prospective sales is down 5%.
During the last twenty years, annual changes in the composite index had an 83% correlation with the change in new home sales. There's been an 86% correlation with the change in single family housing starts.
Traffic of prospective home buyers has been roughly steady at a high level for over a year.
The NAHB index is a diffusion index based on a survey of builders. Readings above 50 signal that more builders view conditions as good than poor.
Visit the National Association of Home Builders using this link.
| Nat'l Association of Home Builders | April | Mar | April '04 | 2004 | 2003 | 2002 |
|---|---|---|---|---|---|---|
| Composite Housing Market Index | 67 | 70 | 69 | 68 | 64 | 61 |
by Carol Stone April 22, 2005
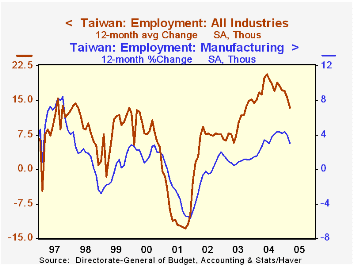
Employment in Taiwan increased by 2,000 in March, continuing a more moderate uptrend that emerged at the turn of the year; February saw a 17,000 rise and January 9,000. Most notably, manufacturing employment has declined the last two months. Other sectors, however, continue to expand, and the unemployment rate edged lower in March to 4.2%. In fact, during the last six months unemployment has hovered very near 4.2%, the lowest level since May 2001, during the world-wide recession associated with the technology "bust".
As seen in the graph, a feature of that recession was the typical cycle in manufacturing employment. But it was exacerbated by a sharp drop in construction industry employment as well. Taiwan is, of course, one of the Asian "NICs" -- newly industrializing countries. A building boom in the first half of the 1990s, which was probably associated with that status, was already slowing down, and the onset of the recession brought a sudden plunge in construction activity and jobs, evident in the second graph. But also seen there, over the last year or so, the construction sector has been on the rebound. Jobs have increased 70,000 since November 2003, a 10% gain. During that same period, service-sector jobs have risen just 2.7% and total employment is up 2.6%. 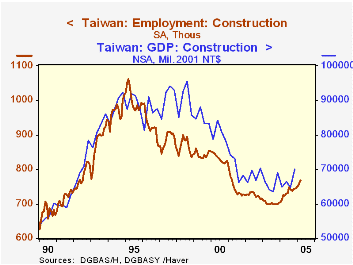
The February-March pause in manufacturing employment is perhaps only transitory, but it raises the question of whether the advance in the construction industry can continue if demand for Taiwan's final products is slowing enough to constrain job growth.
| Taiwan Thousands, Seasonally Adjusted |
Mar 2005 | Feb 2005 | Mar 2004 | 2004 | 2003 | 2002 | 2001 |
|---|---|---|---|---|---|---|---|
| Total Industry Employment | 9,892 | 9,890 | 9,731 | 9,786 | 9,573 | 9,452 | 9,383 |
| Monthly Change | 2 | 17 | 12-Month Average Change | ||||
| 13 | 17 | 15 | 8 | -10 | |||
| Manufacturing | -8 | -5 | 7 | 9 | 3 | 4 | -13 |
| Construction | 10 | 8 | 4 | 4 | -1 | -1 | -8 |
| Service-Producing | 11 | 18 | 8 | 10 | 17 | 5 | 10 |
| Memo: Unemploy- ment Rate | Individual Months | Annual Average | |||||
| 4.2 | 4.3 | 4.5 | 4.4 | 5.0 | 5.2 | 4.6 | |
by Carol Stone April 22, 2005
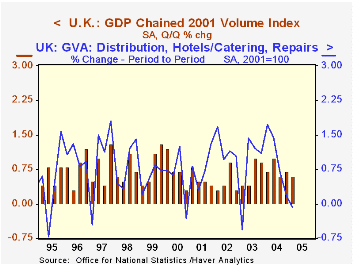
GDP growth in the UK edged lower in Q1 to 0.6% from 0.7% in Q4. We indicated this possibility yesterday in discussing retail sales, which fell outright in March. The four-quarter performance thus stood at 2.8%, the slowest since Q4 2003.
All the major industry sectors participated in the weakening. The overall distribution sector, which includes retail and other trade, as well as hotels, restaurants and repair services, declined 0.1% after gaining 0.2% in Q4. Total services increased 0.8%, marginally less than in Q4. Industrial output also declined 0.1%, the same as in Q4; this sector is now down from a year ago, by 0.2%. Construction activity grew 0.6%, compared to the prior period's 1.1%, and the agricultural sector lost 0.8% after increasing 0.9% in Q4.
| United Kingdom % Changes, Seasonally Adjusted |
Q1 2005 | Q4 2004 | Year Ago | 2004 | 2003 | 2002 |
|---|---|---|---|---|---|---|
| Total GDP | 0.6 | 0.7 | 2.8 | 3.1 | 2.2 | 1.8 |
| Industry | -0.1 | -0.1 | -0.2 | 0.4 | -0.1 | -2.5 |
| Services | 0.8 | 0.8 | 3.6 | 4.1 | 2.5 | 2.7 |
| Distribution, etc. | -0.1 | 0.2 | 2.2 | 5.1 | 3.0 | 4.7 |

Tom Moeller
AuthorMore in Author Profile »Prior to joining Haver Analytics in 2000, Mr. Moeller worked as the Economist at Chancellor Capital Management from 1985 to 1999. There, he developed comprehensive economic forecasts and interpreted economic data for equity and fixed income portfolio managers. Also at Chancellor, Mr. Moeller worked as an equity analyst and was responsible for researching and rating companies in the economically sensitive automobile and housing industries for investment in Chancellor’s equity portfolio. Prior to joining Chancellor, Mr. Moeller was an Economist at Citibank from 1979 to 1984. He also analyzed pricing behavior in the metals industry for the Council on Wage and Price Stability in Washington, D.C. In 1999, Mr. Moeller received the award for most accurate forecast from the Forecasters' Club of New York. From 1990 to 1992 he was President of the New York Association for Business Economists. Mr. Moeller earned an M.B.A. in Finance from Fordham University, where he graduated in 1987. He holds a Bachelor of Arts in Economics from George Washington University.
More Economy in Brief


