 Global| Feb 14 2011
Commodity Prices: Are They A Harbinger of Inflation or Real Growth?
by:Tom Moeller
|in:Economy in Brief
Summary
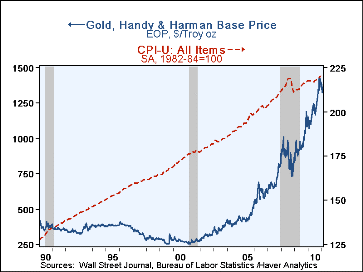
Consumer price inflation has been under control of late with both the overall CPI (1.4%) and the core inflation rate (0.6%) at their lowest since the mid-1960s. A popular harbinger of inflation, however, is the price of gold and it is [...]
Consumer price inflation has been under control of late with both the overall CPI (1.4%) and the core inflation rate (0.6%) at their lowest since the mid-1960s. A popular harbinger of inflation, however, is the price of gold and it is suggesting future strength in pricing power. Yet the accompanying chart clearly indicates a sketchy performance of gold as an inflation indicator. True, the gold price and the CPI lines do roughly cross, 20 years apart. But so what? The level of gold prices rose ten-fold during the period while consumer prices rose just two-thirds. The interim variations in the two series, either levels or rates of change, don't correlate well either. During the last ten years there's been a low 30% correlation.
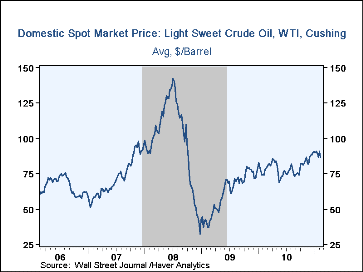
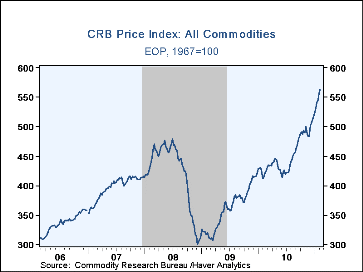
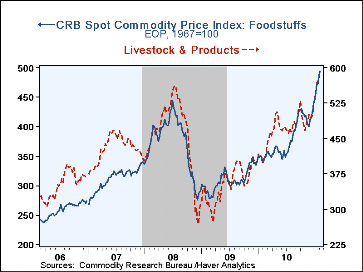
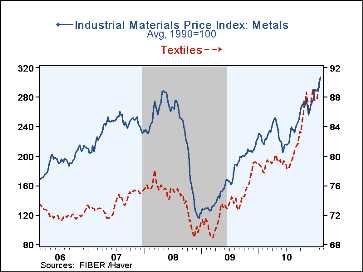
Recently, there has been attendant strength in most other commodity prices.
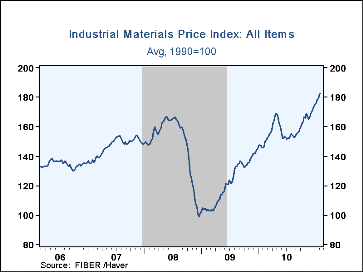
So do they suggest higher prices for finished product prices? In fact the answer is yes. During the last ten years there has been a high 64% correlation between the y/y change in industrial commodity prices and the change in the consumer price index for goods, despite the differing costs of production, processing, packaging, shipping, and retailing for each. The correlation with the overall CPI is a lesser 41% due to the minimal linkage between commodities and the services CPI. As an indicator of future inflation, the correlations fall.
As an indicator of industrial activity alone, commodity prices have even greater value than they do with consumer pricing power. The y/y change in the Journal of Commerce index of industrial commodity prices has a 78% correlation with the change in factory sector output. The bottom line is that commodity prices are being supported by the recent strength in industrial output. Moreover, their strength may eventually support the case for higher prices for finished products, but for now that correlation is being short-circuited.
Commodity price data can be found in Haver's DAILY, WEEKLY and CMDTY databases.
Commodity Prices and Inflation is analysis from the Federal Reserve Bank of San Francisco in 1996. It can be found here.
| Commodity Prices | Latest | Latest Y/Y | 2010 | 2009 | 2008 |
|---|---|---|---|---|---|
| Gold ($ per troy ounce.) | 1,364.00 | 26.1% | 1,224.3 | 972.3 | 872.0 |
| Crude Oil ($ per barrel) | 86.71 | 16.4 | 79.42 | 61.83 | 99.83 |
| Commodity Research Bureau Spot Index - All Commodities (1967=100) | 564 | 35.6 | 451 | 361 | 422 |
| Foodstuffs | 495 | 44.0 | 379 | 310 | 373 |
| Livestock & Products | 570 | 40.1 | 470 | 355 | 457 |
| FIBER Industrial Materials Price Indexes (1990=100) | 183 | 23.6 | 158 | 122 | 148 |
| Textiles | 92 | 17.1 | 81 | 73 | 74 |
| Cotton (cents per pound) | 180 | 168.7 | 88.0 | 52.6 | 58.1 |
| Metals | 304 | 38.9 | 240 | 169 | 231 |
| Aluminum ($ per metric ton) | 2,503 | 24.4 | 2,173 | 1,665 | 2,572 |
| Copper Scrap (cents per pound) | 448 | 58.8 | 327 | 197 | 281 |
| Steel Scrap ($ per ton) | 440 | 45.9 | 327 | 204 | 350 |
| Miscellaneous | 200 | 23.1 | 179 | 128 | 159 |
| Natural Rubber (cents per pound) | 324 | 163.6 | 183 | 84 | 124 |
| Framing Lumber ($ per 1000 board) | 297 | -2.6 | 293 | 221 | 253 |
Tom Moeller
AuthorMore in Author Profile »Prior to joining Haver Analytics in 2000, Mr. Moeller worked as the Economist at Chancellor Capital Management from 1985 to 1999. There, he developed comprehensive economic forecasts and interpreted economic data for equity and fixed income portfolio managers. Also at Chancellor, Mr. Moeller worked as an equity analyst and was responsible for researching and rating companies in the economically sensitive automobile and housing industries for investment in Chancellor’s equity portfolio. Prior to joining Chancellor, Mr. Moeller was an Economist at Citibank from 1979 to 1984. He also analyzed pricing behavior in the metals industry for the Council on Wage and Price Stability in Washington, D.C. In 1999, Mr. Moeller received the award for most accurate forecast from the Forecasters' Club of New York. From 1990 to 1992 he was President of the New York Association for Business Economists. Mr. Moeller earned an M.B.A. in Finance from Fordham University, where he graduated in 1987. He holds a Bachelor of Arts in Economics from George Washington University.


