 Global| Nov 20 2012
China's First Steps Toward More Consumption
Summary
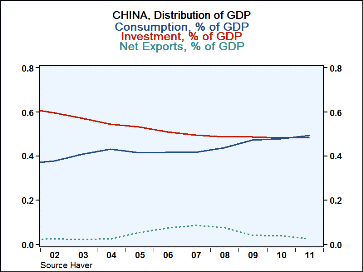
For the last twenty five years or so, in its rush to modernize, China has stressed Investment and Exports over Consumption. 2011 was the first year in which consumption as a percentage of GDP exceeded that of Investment 49.2% vs 48.2% [...]
 For the last twenty five years or so, in its rush to modernize, China has stressed Investment and Exports over
Consumption. 2011 was the first year in which consumption as a
percentage of GDP exceeded that of Investment 49.2% vs 48.2% as can be
seen in the first chart. The trend has continued into this
year. Quarterly data on GDP by expenditures are not available for
China. One must await for the annual figures. In the meantime,
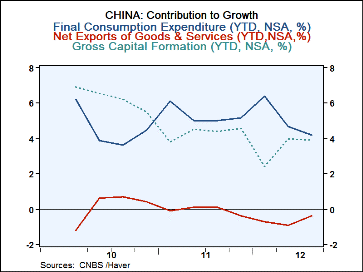
data showing the percentage points of the components of growth
are available on a quarterly basis. Ever since the first
quarter of 2011 consumption has contributed more to GDP than investment,
as can be seen in the second chart.
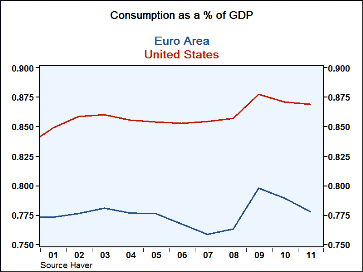
China has a long way to go to even approach the consumptions ratios of the developed nations. These can be computed from the national accounts data in any of several Haver data bases, G10, for example is one. Consumption in G10 includes private expenditures plus government expenditures and is therefore comparable with the China data on consumption. Using the data in G10, we computed the consumption ratios for the U. S. and the Euro Area and are shown in the third chart. In 2011, the consumption ratio for the US was 86.9% and for the Euro Area, 77.8%
| CHINA | ||||||||
| Distribution of GDP | 2011 | 2010 | 2009 | 2008 | 2007 | 2006 | 2005 | 2004 |
| Consumption (% of GDP) | 49.16 | 48.06 | 47.16 | 43.70 | 41.62 | 41.76 | 41.34 | 43.02 |
| Investment (% of GDP) | 48.23 | 48.19 | 48.53 | 48.55 | 49.61 | 50.76 | 53.01 | 54.45 |
| Net Exports (% of GDP) | 2.61 | 3.74 | 4.31 | 7.67 | 8.79 | 7.48 | 5.45 | 2.63 |
| Contribution to Growth | Q3'12 | Q2'12 | Q1'12 | Q4'11 | Q3'11 | Q2'11 | Q1'11 | Q4'10 |
| Consumption (% points) | 4.20 | 4.70 | 8.40 | 5.17 | 5.00 | 5.00 | 6.10 | 4.49 |
| Investment (% points) | 3.90 | 4.00 | 2.40 | 4.54 | 4.40 | 4.50 | 3.80 | 5.50 |
| Net Exports (% points) | -0.40 | -0.90 | -0.70 | -0.40 | 0.10 | 0.10 | 0.40 | 0.41 |
More Economy in Brief
 Global| Feb 05 2026
Charts of the Week: Balanced Policy, Resilient Data and AI Narratives
by:Andrew Cates


