 Global| May 23 2007
Chile GDP Growth Picks Up in Q1; Copper Up, but Other Sectors Also Expanding
Summary
Growth in the Chilean economy strengthened in Q1, according to data released this morning by the Central Bank. GDP grew 3.0% from Q4 2006 versus 2.0% in Q4 from Q3; the latest was the largest quarter-to-quarter growth since Q4 1997 in [...]

Growth in the Chilean economy strengthened in Q1, according to data released this morning by the Central Bank. GDP grew 3.0% from Q4 2006 versus 2.0% in Q4 from Q3; the latest was the largest quarter-to-quarter growth since Q4 1997 in data seasonally adjusted by Haver Analytics. On a year-to-year basis, the more closely watched not-seasonally-adjusted figure was up 5.8%, the largest growth since Q2 2005.
Among industries, the boost to year/year growth came from the leader in Chile, copper mining (6.2% of GDP in 2006), which escalated from a mere 0.5% in Q4 to 7.1% in the latest period. Another major contributor was the trade and hotel/restaurant sector (10.0% of GDP), which picked up from 3.8% in Q4 to 6.9% in Q1. Other gains were widespread as well.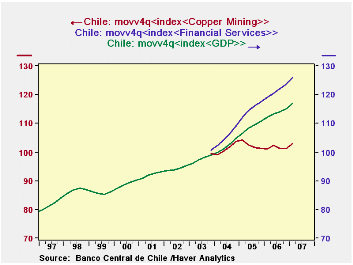
The Chilean economy does appear to be diversifying. While copper mining remains the keystone, other industry sectors are moving ahead. The value-added data for industries are available since 2003. In the second graph, we've indexed the NSA figures for Q2 2003 and then applied a 4-quarter moving average. This illustrates the "nested function" feature of the new DLXVG3, now in internal testing here at Haver. We've also edited the titles a bit -- you can already do that, of course -- but ordinarily they will show the database "code" for the series to signal to the analyst that calculations are in "nested" mode. Anyway, this graph indicates that copper production has held basically steady over the last four years, but financial services are growing more rapidly than GDP. Other service sectors, especially communications, are also expanding.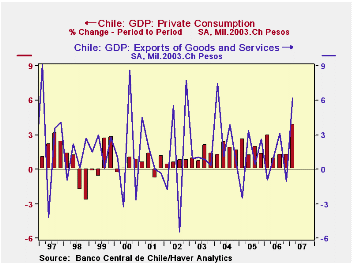
On the demand side, every major line item performed well in Q1. Private consumption was up 7.7% from the year earlier versus 6.7% in Q4. Fixed investment accelerated to 7.9% in Q1 from 3.0% in Q4. And exports surged by 9.5% following "just" 2.3%, while imports grew 10.0% compared with 8.3%.
| CHILE (% Changes) | Q1 2007(SAQR*) | Q4 2006 (SAQR*) | Q3 2006 (SAQR*) | Year/Year | 2006 | 2005 | 2004 |
|---|---|---|---|---|---|---|---|
| Real GDP | 3.0 | 2.0 | -0.3 | 5.8 | 4.0 | 5.7 | 6.0 |
| Copper Industry | 5.3 | 6.7 | -4.5 | 7.1 | 0.1 | -2.5 | 4.5 |
| Private Consumption | 3.9 | 1.3 | 1.3 | 7.7 | 7.1 | 7.9 | 7.0 |
| Gross Fixed Investment | 5.2 | 0.6 | 3.0 | 7.9 | 4.0 | 21.9 | 9.9 |
| Exports G & S | 6.2 | -1.0 | 3.1 | 9.5 | 4.2 | 3.5 | 11.7 |
| Imports G & S | 3.8 | 2.6 | 2.5 | 10.0 | 9.4 | 17.7 | 16.9 |
by Robert Brusca May 23, 2007
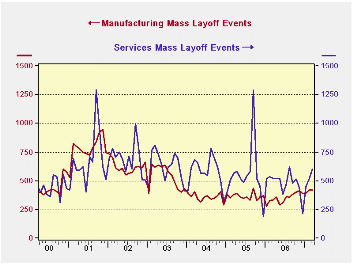
The graph on the left shows layoff trends by events - the number of reported layoff events - through the first quarter. While there is a bit of upward pressure evident in that chart, a good deal of that is purely seasonal. The services line seems to be accelerating. But a closer look at the data shows that services lay off events for January and February are below the levels in 2006; cumulative layoff events did rise in March above what is seasonably normal and that has boosted the year to date total to be even with 2006, after being below it for January and February.
As far as the number of workers laid off, those figures are lower in Q1 2007 than in Q1 2006. Their pattern has been choppy.
The big picture trend seems to show some slight upward pressure on the incidence of layoff events.
But if we construct the same sort of chart on the number of persons laid off, instead of events, the layoff total for Q1 is down sharply. So while the number of incidents may have risen in the service sector for April, for Q1, taken as a whole, the number of workers laid off is down sharply. Actually, the number of service workers laid off in mass events according to the definition* is closer to half of that for Q1 last year. For MFG the number of workers laid off is also low relative to last year and relative to this expansion cycle. Construction layoffs are up significantly in Q1 2007 compared to Q1 2006, at 27,000 compared to 21,341 in the year-ago quarter. But the number of construction layoffs is still moderate by the standards of the past six years where layoffs in Q1 had previously averaged 26,036.
On balance there is no evidence of layoffs rising in a significant way in any sector although there is some tentative evidence that the incidence of layoff events - apparently smaller events -- may have stepped up its pace. Construction may yet prove to be an exception though the data are not clear.
| Number of Separations | |||
| Manufacturing | Services | Construction | |
| Q1-07 | 51,424 | 59,545 | 27,457 |
| Change Yr Yr | |||
| Q1-07 | -11,712 | -38,688 | 6,116 |
| Q4-06 | 22,079 | 17,573 | 5,572 |
| Q3-06 | 530 | -47,862 | 5,611 |
| Q2-06 | 15,456 | 32,559 | 710 |
Carol Stone, CBE
AuthorMore in Author Profile »Carol Stone, CBE came to Haver Analytics in 2003 following more than 35 years as a financial market economist at major Wall Street financial institutions, most especially Merrill Lynch and Nomura Securities. She had broad experience in analysis and forecasting of flow-of-funds accounts, the federal budget and Federal Reserve operations. At Nomura Securities, among other duties, she developed various indicator forecasting tools and edited a daily global publication produced in London and New York for readers in Tokyo. At Haver Analytics, Carol was a member of the Research Department, aiding database managers with research and documentation efforts, as well as posting commentary on select economic reports. In addition, she conducted Ways-of-the-World, a blog on economic issues for an Episcopal-Church-affiliated website, The Geranium Farm. During her career, Carol served as an officer of the Money Marketeers and the Downtown Economists Club. She had a PhD from NYU's Stern School of Business. She lived in Brooklyn, New York, and had a weekend home on Long Island.
More Economy in Brief


