 Global| Nov 30 2009
Chicago Purchasing Managers IndexImproves Steadily
by:Tom Moeller
|in:Economy in Brief
Summary
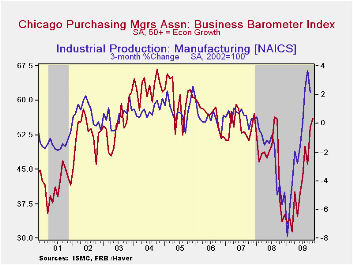
The Chicago Purchasing Managers' Association reported that its November Business Barometer improved to the highest level since August of last year. The index level of 56.1 was up sharply from the March low of 31.4. The survey covers a [...]
 The
Chicago Purchasing Managers' Association reported that its November
Business Barometer improved to the highest level since August of last
year. The index level of 56.1 was up sharply from the March low of
31.4. The survey covers a sample of over 200 purchasing professionals
in the Chicago area with a monthly response rate of about 50%. During
the last ten years there has been a 72% correlation between the
Business Barometer and the three-month change in factory sector
industrial production.
 The
Association indicated that gains in the
index of vendor deliveries (slower speed), order backlogs and
employment contributed greatly to the November rise in the overall
index. The new orders index rose modestly m/m but was more than double
the year-ago level. The production component fell and reversed much of
the prior month's increase. Nevertheless, it remained nearly double the
January low.
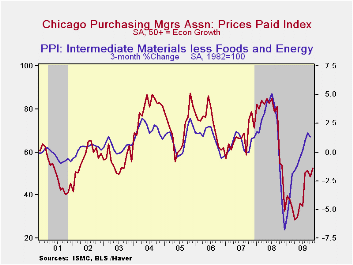
The index of prices paid increased and made up an October decline. The latest level was more than double its May low. During the last ten years there has been a 78% correlation between the Prices Paid Index and the three-month change in the PPI for intermediate materials.
Why Are Banks Failing? from the Federal Reserve Bank of St. Louis can be found here .
| Chicago Purchasing Mgs. | November | October | September | November '08 | 2008 | 2007 | 2006 |
|---|---|---|---|---|---|---|---|
| Business Barometer | 56.1 | 54.2 | 46.1 | 33.6 | 46.8 | 54.4 | 56.8 |
| Production | 57.6 | 63.9 | 47.2 | 34.1 | 48.1 | 58.3 | 60.3 |
| New Orders | 62.8 | 61.4 | 46.3 | 29.2 | 46.7 | 57.7 | 59.9 |
| Employment | 41.9 | 38.3 | 38.8 | 33.4 | 41.4 | 51.5 | 51.6 |
| Prices Paid | 52.6 | 48.6 | 51.3 | 54.1 | 73.5 | 66.5 | 72.8 |
EMU Prices Rise - Has The Worm Tuned?
by Robert Brusca November 30, 2009

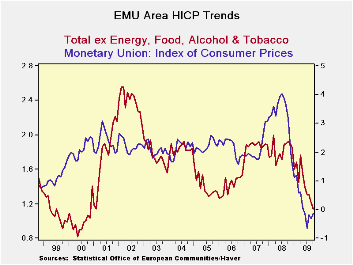
EMU prices rose in October. Trends are still good but core inflation is showing a hint of acceleration as three month core prices are up at a 1.4% annual rate above their six-month and 12-month pace of increase.
Headline inflation shows a clear acceleration from an annual pace of -0.1% Yr/Yr to a +1.2% annual rate over six-months and to a 2.3% annualized pace over three- months.
Germany, France, Italy and Spain all show the same accelerating headline inflation pattern from 12-months to six-months to three-months. Italy’s 3-mo inflation rate is up to 3.4% annualized.
Core inflation has much less clear patterns across countries.
Core inflation is not accelerating from 12-months to six-months to three-months in any of these large EMU countries. It is accelerating from six-months to three-months in Germany and in Italy. But that similarity has little breadth. In Italy core inflation is running at a strong 4.1% pace. In Germany it is at 1.1% only the same as its Yr/Yr pace but up from its six-month pace. In France the core rate is still steadily decelerating. Spain’s core is back down after a pop-up over six-months.
On balance combined with news that UK consumers are repaying credit this holiday season and that German firms are having a tough time getting credit, it hardly seems that inflation is about to take root. The recent rise in energy prices is the reason for most headline inflation to be creeping higher. Core inflation is still largely under wraps. Still it is notable that inflation is starting to show some traces in the more inflation-prone country of Italy.
We don’t expect any policy change in EMU but the inflation worm may be starting its turn. Even so we expect it to be a big slow turn, even for a worm.
| Trends in HICP | |||||||
|---|---|---|---|---|---|---|---|
| % mo/mo | % saar | ||||||
| Oct-09 | Sep-09 | Aug-09 | 3-Mo | 6-Mo | 12-Mo | Yr Ago | |
| EMU | 0.2% | -0.1% | 0.5% | 2.7% | 1.2% | -0.1% | 3.2% |
| Core | 0.1% | 0.0% | 0.2% | 1.4% | 1.0% | 1.0% | 2.4% |
| Goods | 0.4% | 0.5% | 0.4% | 5.5% | -0.2% | -1.4% | 3.5% |
| Services | 0.1% | -0.7% | 0.2% | -1.7% | 1.1% | 1.8% | 2.6% |
| HICP | |||||||
| Germany | 0.2% | -0.3% | 0.7% | 2.3% | 0.7% | -0.1% | 2.5% |
| France | 0.0% | -0.1% | 0.5% | 1.3% | 0.8% | -0.2% | 3.0% |
| Italy | 0.0% | 0.4% | 0.5% | 3.4% | 1.1% | 0.2% | 3.6% |
| Spain | 0.1% | -0.3% | 0.7% | 2.1% | 1.9% | -0.6% | 3.6% |
| Core:xFE&A | |||||||
| Germany | 0.1% | -0.2% | 0.4% | 1.1% | 0.9% | 1.1% | 1.5% |
| France | 0.0% | -0.1% | 0.3% | 0.6% | 0.9% | 1.0% | 2.3% |
| Italy | 0.2% | 0.4% | 0.5% | 4.1% | 1.7% | 1.4% | 3.0% |
| Spain | 0.0% | -0.1% | 0.1% | 0.2% | 0.7% | 0.2% | 2.9% |
The Canadian Economy Begins to Show Growth
by Louise Curley November 30, 2009

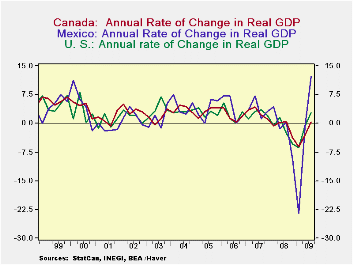
Canada's Real Gross Domestic Product rose 0.40% on an annual rate basis in the third quarter, its first increase after three quarters of decline. The annual rate of rise was smaller than the 2% the Bank of Canada had predicted a month or so ago and smaller than more recent consensus estimate of 1.0%. Canada's annual rate of growth in the third quarter was also below those of the Mexico and the United States, its NAFTA partners, as can be seen in the first chart.
The annual rates of change of the major components of real GDP are shown in the table below. Private consumption showed its first increase in the second quarter and has continued to increase in the third quarter. Private fixed investment and exports have had their first increases in the third quarter. Canada's stimulus programs are reflected in the increases in Government consumption and fixed investment over the past several quarters.
The dynamics of the change in Canada's third quarter GDP is best seen by looking at the contribution (the weighted percent changes) of the various components of GDP to total growth. The quarterly increase in GDP in the third quarter was 0.088%. Private consumption contributed .448 points; private fixed investment,.246; inventories, .229; government spending on goods and services, .265; government fixed investment, .218 and government inventories .001. Exports contributed .998. These positive contributions amounted to 2.405 points. They were, however, offset by the 2.316 point negative contribution of imports. Part of the rise in imports was due to the increase in private and government fixed investment. It has been estimated that Canadian businesses import more than 70% of their spending on plant and equipment.
| Annual Rates of Change | Q3 09 | Q2 09 | Q1 09 | Q4 08 | Q3 08 | Q2 08 | Q1 08 |
|---|---|---|---|---|---|---|---|
| Real Gross Domestic Product | 0.35 | -3.05 | -6.19 | -3.74 | 0.41 | 0.33 | -0.75 |
| Private Consumption | 3.08 | 1.76 | -1.41 | -3.13 | 0.57 | 1.10 | 2.54 |
| Private Fixed Investment | 5.60 | -9.03 | -27.00 | -18.59 | 0.45 | -2.13 | -1.73 |
| Government Consumption | 4.99 | 3.27 | 2.15 | 2.48 | 0.02 | 4.56 | 5.67 |
| Government Fixed Investment | 24.66 | 16.55 | 8.60 | 8.72 | 7.11 | 11.81 | 18.89 |
| Exports | 15.35 | -19.54 | -29.81 | -17.69 | -4.15 | -4.11 | -2.30 |
| Imports | 36.0 | -6.91 | -39.24 | -23.36 | -3.44 | 2.99 | -4.68 |
Tom Moeller
AuthorMore in Author Profile »Prior to joining Haver Analytics in 2000, Mr. Moeller worked as the Economist at Chancellor Capital Management from 1985 to 1999. There, he developed comprehensive economic forecasts and interpreted economic data for equity and fixed income portfolio managers. Also at Chancellor, Mr. Moeller worked as an equity analyst and was responsible for researching and rating companies in the economically sensitive automobile and housing industries for investment in Chancellor’s equity portfolio. Prior to joining Chancellor, Mr. Moeller was an Economist at Citibank from 1979 to 1984. He also analyzed pricing behavior in the metals industry for the Council on Wage and Price Stability in Washington, D.C. In 1999, Mr. Moeller received the award for most accurate forecast from the Forecasters' Club of New York. From 1990 to 1992 he was President of the New York Association for Business Economists. Mr. Moeller earned an M.B.A. in Finance from Fordham University, where he graduated in 1987. He holds a Bachelor of Arts in Economics from George Washington University.
More Economy in Brief
 Global| Feb 05 2026
Charts of the Week: Balanced Policy, Resilient Data and AI Narratives
by:Andrew Cates


