Haver Analytics
Haver Analytics
Global| Jun 30 2016

Chicago Purchasing Managers Index Recovers Sharply

Summary

Chicago purchasing managers reported that their Business Barometer surged to 56.8 this month following a May decline to 49.3. The figure was at the highest level since January 2015, and exceeded expectations for 50.4 in the Action [...]

U

Chicago purchasing managers reported that their Business Barometer surged to 56.8 this month following a May decline to 49.3. The figure was at the highest level since January 2015, and exceeded expectations for 50.4 in the Action Economics Forecast Survey.

Haver Analytics constructs an ISM-Adjusted Index using the Chicago numbers, comparable to the overall ISM index to be released tomorrow. Our figure increased to 52.9, the highest level since October. During the last ten years, there has been a 61% correlation between the adjusted Chicago Purchasing Managers index and real GDP growth.

Increases in the component series were widespread. Most notable was a 14.4 point gain in the new orders index to 63.2, the highest level since October 2014. The order backlog measure also surged 12.0 points to the highest level (59.7) since March 2011. The production and inventory indexes increased moderately to 56.3 and 50.0, respectively.      

The employment figure also declined 3.3 points to 45.0, the lowest level since November 2009. During the last ten years, there has been an 80% correlation between the employment figure and the m/m change in factory sector employment. Supplier delivery speeds quickened, prompting a decline in the index.

The prices paid reading eased to 55.7, leaving the Q2 average of 56.4 above the Q1 mean of 43.3. An increased 25% (NSA) of respondents reported paying higher prices while 10% paid less.

The MNI Chicago Report is produced by MNI/Deutsche Borse Group in partnership with ISM-Chicago. The survey covers a sample of over 200 purchasing professionals in the Chicago area with a monthly response rate of about 50%. The ISM-Adjusted headline index is calculated by Haver Analytics using these data to construct a figure with the ISM methodology. The figures can be found in Haver's SURVEYS database. The Consensus expectations figure is available in AS1REPNA.

Monetary Policy Transmission before and after the Crisis from the Federal Reserve Bank of New York can be found here http://libertystreeteconomics.newyorkfed.org/2016/06/monetary-policy-transmission-before-and-after-the-crisis.html#.V3QeiJAm6po

Chicago Purchasing Managers Index (%, SA) Jun May Apr Jun '15 2015 2014 2013 General Business Barometer 56.8 49.3 50.4 49.2 50.3 60.7 56.0 ISM-Adjusted General Business Barometer 52.9 48.0 52.0 49.5 51.6 59.3 54.2   Production 56.3 47.4 54.0 50.4 52.5 64.5 58.2   New Orders 63.2 48.8 51.0 51.2 50.4 63.8 59.1   Order Backlogs 59.7 47.7 38.7 42.9 44.4 54.2 48.8   Inventories 50.0 37.9 49.6 47.9 52.1 55.9 45.6   Employment 45.0 48.3 47.5 47.2 50.3 56.0 55.6   Supplier Deliveries 50.0 57.8 57.8 50.7 52.5 56.5 52.5   Prices Paid 55.7 56.5 56.9 50.4 46.8 61.0 59.8


U.S. Initial Claims for Unemployment Insurance Rise
by Tom Moeller  June 30, 2016

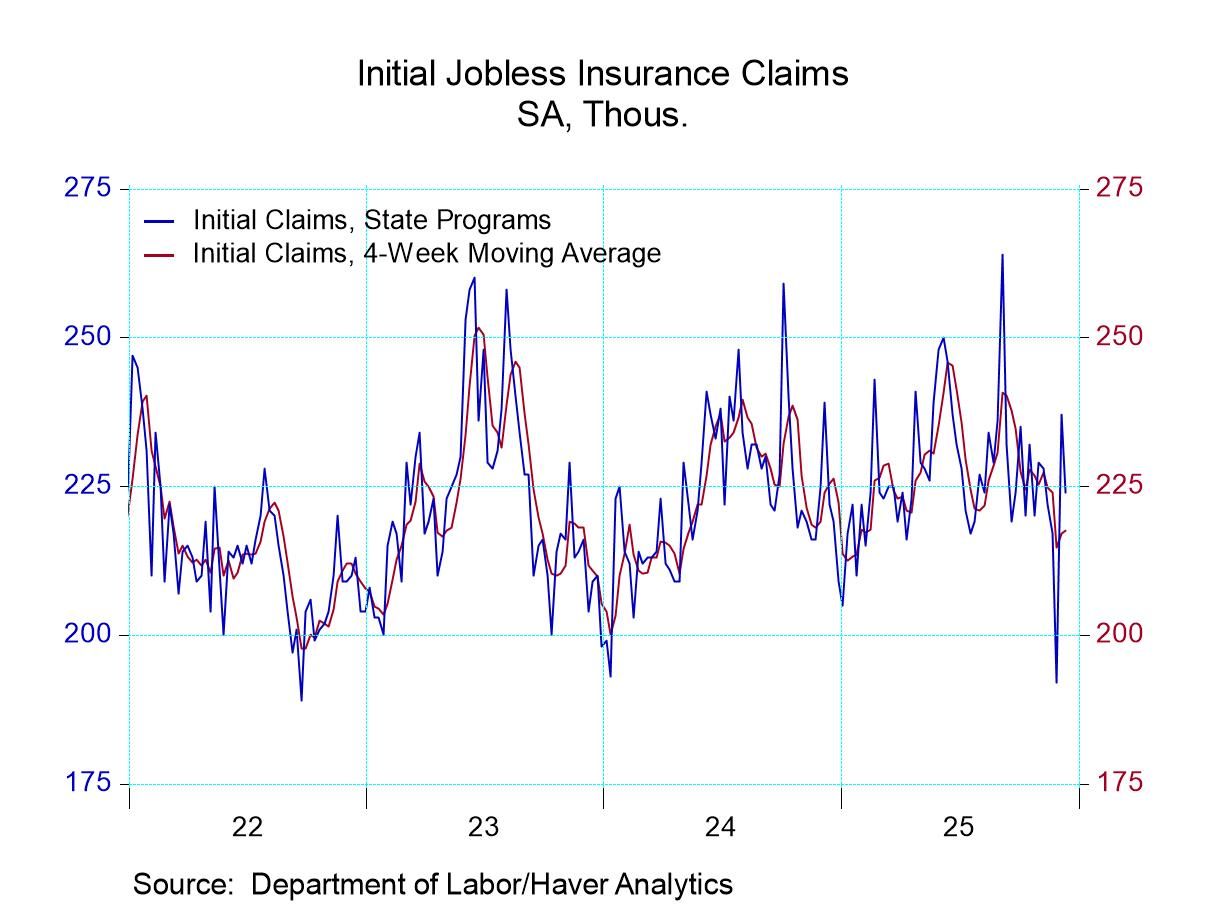
Initial jobless insurance claims increased to 268,000 (-4.3% y/y) during the week ended June 25 from 258,000 in the prior week, revised from 259,000. The Action Economics Forecast Survey expected 270,000 claims. The four-week moving average of claims remained steady at 266,750. During the last ten years, there has been a 74% correlation between the level of claims and the m/m change in payroll employment.

In the week ending June 18, continuing claims for unemployment insurance declined to 2.120 million (-6.7% y/y) from 2.140 million. Claims were near the lowest level since 2000. The four-week moving average fell to 2.134 million.

The insured rate of unemployment eased to a record low of 1.5%.

Insured rates of unemployment across states continued to vary. Near the low end of the range were South Dakota (0.37%), Florida (0.64%), Indiana (0.76%), Tennessee (0.80%), Virginia (0.86%) and South Carolina (0.89%). At the high end of the scale were Texas (1.66%), Massachusetts (1.77%), Nevada (1.79%), Illinois (1.96%), New Jersey (2.22%) and Pennsylvania (2.25%). The state data are not seasonally adjusted.

Data on weekly unemployment insurance are contained in Haver's WEEKLY database and they are summarized monthly in USECON. Data for individual states are in REGIONW. The expectations figure is from the Action Economics survey, carried in the AS1REPNA database.

Unemployment Insurance (000s) 06/25/16 06/18/16 06/11/16 Y/Y 2015 2014 2013
Initial Claims 268 258 277 -4.3% 277 307 342
Continuing Claims -- 2,120  2,140 -6.7 2,268 2,607 2,978
Insured Unemployment Rate (%) -- 1.5 1.6

1.7
(June 2015)

1.7 2.0 2.3
  • Prior to joining Haver Analytics in 2000, Mr. Moeller worked as the Economist at Chancellor Capital Management from 1985 to 1999. There, he developed comprehensive economic forecasts and interpreted economic data for equity and fixed income portfolio managers. Also at Chancellor, Mr. Moeller worked as an equity analyst and was responsible for researching and rating companies in the economically sensitive automobile and housing industries for investment in Chancellor’s equity portfolio.   Prior to joining Chancellor, Mr. Moeller was an Economist at Citibank from 1979 to 1984.   He also analyzed pricing behavior in the metals industry for the Council on Wage and Price Stability in Washington, D.C.   In 1999, Mr. Moeller received the award for most accurate forecast from the Forecasters' Club of New York. From 1990 to 1992 he was President of the New York Association for Business Economists.   Mr. Moeller earned an M.B.A. in Finance from Fordham University, where he graduated in 1987. He holds a Bachelor of Arts in Economics from George Washington University.

    More in Author Profile »

More Economy in Brief