 Global| Nov 30 2005
Chicago Purchasing Managers' "Business Barometer" Holds Up; Prices Accelerate to 26-Year High
Summary
The Chicago Purchasing Managers Business Barometer was 61.7 for November, down slightly from October's 62.7, but firmer than forecasts of about 60.0. This was the third straight reading above 60, a favorable performance after about [...]
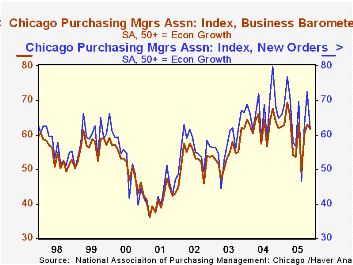
The Chicago Purchasing Managers Business Barometer was 61.7 for November, down slightly from October's 62.7, but firmer than forecasts of about 60.0. This was the third straight reading above 60, a favorable performance after about six months of saw tooth behavior.
The new orders index, however, kept up the seesaw pattern, as it fell back 11.0 points to 61.6 after October's 9.2-point increase; the October advance, notably, was corroborated in yesterday's report of a 3.4% surge in the value of national durable goods orders in October. The Chicago production index eased 4.5 points, partially reversing its October gain. Employment fell by a point to 50.3, indicating a marginal expansion of factory jobs in the Chicago region. 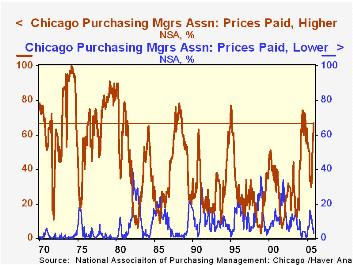
While the components describing real manufacturing activity portray a fairly optimistic picture, the index of prices paid may cause some worry. It rose once again, reaching 94.1, the highest since August 1979, when inflation in general was pretty rapid. This comparison, however, calls our attention to an important distinction in the Chicago and other Purchasing Manager surveys: these surveys count the number of firms reporting moves in a specific direction, not the magnitude of the move. Thus, many firms paid higher prices and fewer firms paid lower prices, but we have no idea how much those prices changed. Also note that the run-up in the overall index in fact resulted partially from a reduction in the number of firms paying lower prices, from 6% to 3%; as recently as August, this deflationary factor was 11% and 16% in May. The number of firms paying higher prices represents 67% of the total, a high figure, but not so dramatic as in earlier inflation periods and not even as high as several readings last year in the mid-70s.
| Chicago Purchasing Managers Index, SA | Nov | Oct | Oct '04 | 2004 | 2003 | 2002 |
|---|---|---|---|---|---|---|
| Business Barometer | 61.7 | 62.9 | 67.7 | 62.9 | 54.6 | 52.8 |
| New Orders | 61.6 | 72.6 | 79.7 | 67.0 | 58.0 | 56.2 |
| Prices Paid | 94.1 | 79.6 | 84.7 | 80.1 | 55.8 | 56.9 |
by Carol Stone November 30, 2005
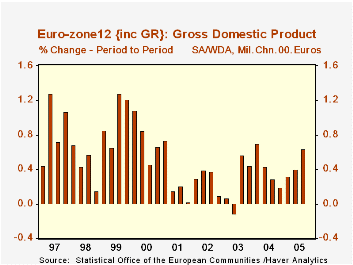
Eurostat made its first full report of Q3 GDP today. Total growth was 0.6%, the same as estimated a couple of weeks ago in the "flash" report for both Euro-zone12 and the EU25 . This new figures represent the routine addition of more countries, specifically Denmark and Poland. But in this report, Eurostat made important methodological changes as well, most notably shifting to chain weighting to calculate the volume measures of GDP and its components. They also changed the treatment of "FISIM", the imputed value of "financial services indirectly measured".
As to the performance, seen in the table below, growth picked up somewhat to 0.6% in Q3 from 0.4% in Q2. Final consumption grew 0.4%, slightly more than the 0.3% in the prior period; both public and private consumption participated. Exports were the other source of advance, surging by 3.4% after 2.2% in Q2. This put yearly expansion of exports at 5.2% from Q3 2004, largely keeping up the strong 5.9% pace set for last year as a whole. Imports gained a little more in the latest quarter. Overall capital formation looks weak, but importantly, the slowdown here is due to much smaller inventory accumulation; fixed investment advanced considerably, 1.6%, after 0.8% in Q2. This is the strongest investment gain since early 2000.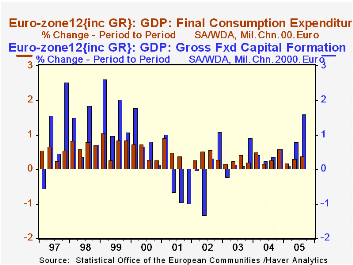
Regarding the methodology, the change to FISIM involves allocating it to the specific industry sectors where it applies and removing it as an explicit adjustment between gross value added and gross domestic product. The net numerical result appears as an upward revision to nominal GDP, according to Eurostat, of about 1.0% in the Euro-zone and about 0.6% for the EU25.
Chain-linking is by now fairly well-known, and actually had remarkably little impact on total reported Euro-zone growth. History runs back only to 1995; perhaps the effect would have been greater in earlier years. Eurostat's press release shows changes in total growth of only 0.1%, up or down, in some quarters, but not in all and without trend. It's important to note that not all Euro-zone countries yet produce chain-weighted accounts. Italy and Belgium are two countries where no chaining is done; France's quarterly data is also not yet chained. So data for these three countries in particular remain in fixed-weight terms in the relevant Haver databases (ITALY, BENELUX and FRANCE, as well as EUROSTAT and G10).
| EuroZone12 GDP: Chained 2000 Euros | Q3 2005 | Q2 2005 | Q3 2004 (yr/yr) | Yearly Totals|||
|---|---|---|---|---|---|---|
| 2004 | 2003 | 2002 | ||||
| GDP | 0.6 | 0.4 | 1.6 | 1.8 | 0.7 | 1.0 |
| Final Consumption | 0.4 | 0.3 | 1.5 | 1.3 | 1.2 | 1.4 |
| Gross Capital Formation | 0.2 | 1.2 | 1.6 | 3.5 | 1.7 | -2.9 |
| Exports | 3.4 | 2.2 | 5.2 | 5.9 | 1.3 | 1.8 |
| -Imports | 2.8 | 2.6 | 5.2 | 6.1 | 3.1 | 0.4 |
Carol Stone, CBE
AuthorMore in Author Profile »Carol Stone, CBE came to Haver Analytics in 2003 following more than 35 years as a financial market economist at major Wall Street financial institutions, most especially Merrill Lynch and Nomura Securities. She had broad experience in analysis and forecasting of flow-of-funds accounts, the federal budget and Federal Reserve operations. At Nomura Securities, among other duties, she developed various indicator forecasting tools and edited a daily global publication produced in London and New York for readers in Tokyo. At Haver Analytics, Carol was a member of the Research Department, aiding database managers with research and documentation efforts, as well as posting commentary on select economic reports. In addition, she conducted Ways-of-the-World, a blog on economic issues for an Episcopal-Church-affiliated website, The Geranium Farm. During her career, Carol served as an officer of the Money Marketeers and the Downtown Economists Club. She had a PhD from NYU's Stern School of Business. She lived in Brooklyn, New York, and had a weekend home on Long Island.
More Economy in Brief


