 Global| Jun 30 2008
Chicago Purchasing Managers' Barometer Slightly Improved
by:Tom Moeller
|in:Economy in Brief
Summary
The Chicago Purchasing Manager's Association reported that its June business barometer improved, for the fifth straight month, to a still low level of 49.6 from 49.1 in May. Consensus expectations had been for weaker reading of 48.0. [...]
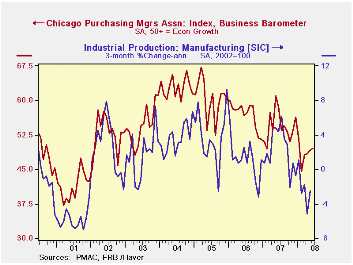
The Chicago Purchasing Manager's Association reported that its June business barometer improved, for the fifth straight month, to a still low level of 49.6 from 49.1 in May. Consensus expectations had been for weaker reading of 48.0.
During the last ten years there has been a 67% correlation
between the index and the three-month change in US factory sector
industrial production. There has been an 85% correlation between the
Chicago figure and the national ISM index (due for release tomorrow)
and that is the highest correlation of all the regional series with the
national ISM index.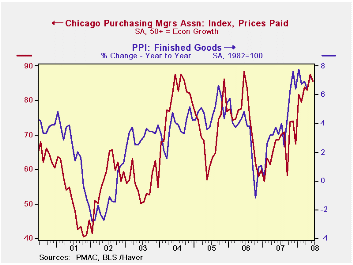
The components of the overall index had varying performance. To the upside was the employment index which rose to 46.7, the highest level since January. Also up were the inventories and vendor deliveries components.
To the downside was the production component to the lowest level since early 2002. Also down slightly were the new orders and the orders backlog components.
The prices paid index dipped slightly 85.5 which was still near the recent highs. During the last ten years there has been a 48% correlation between the price index and the three-month change in the finished goods PPI.
Last week's speech titled Global Economic Integration and Decoupling by Federal Reserve Vice Chairman Donald L. Kohn can be found here.
The minutes to the Fed meetings held on March 14 and 16, regarding Bear Stearns, are available here and here.
| Chicago PMI | June | May | June '07 | 2007 | 2006 | 2005 |
|---|---|---|---|---|---|---|
| Chicago PMI Business Barometer Index | 49.6 | 49.1 | 58.7 | 54.4 | 56.8 | 60.4 |
by Louise Curley June 30, 2008
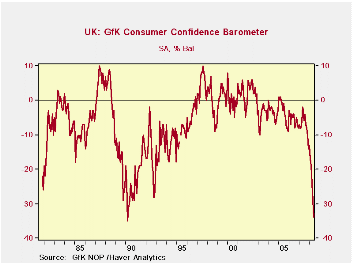
Consumer confidence in the U. K. has declined by 5 percentage
points in each of the last three months and is now -34%, one point
short of the lowest value recorded in March, 1990 as shown in the first
chart. Consumer confidence in the U. K. is measured by the market
research firm, GfK NOP. The measure is the percent balance between
those who view current economic and financial conditions and prospects
positively and those who view them negatively.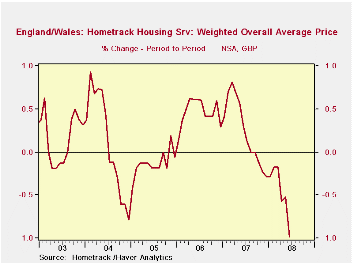
The decline in consumer confidence is no surprise. Consumers in the U.K., like those in many other countries, have been buffeted by rising inflation, slowing growth in jobs, declining house prices, foreclosures, and so on. There does not appear to be much, if any, relief in sight. The Hometrack Housing Survey, also released today, showed that house prices declined another 1% in June. They are now 5,800 GBP lower than in September 2007, as can be seen in the second chart.The Hometrack house price is mix adjusted, that is, the relative weight given to each characteristic of the house remains the same from one period to another. It is an attempt to measure the change in the price of a specific house from one period to the next. It is notthe change in average price of all houses sold.
| UNITED KINGDOM | Jun 08 | May 08 | Apr 08 | Mar 08 | Feb 08 | 2007 | 2006 | 2005 |
|---|---|---|---|---|---|---|---|---|
| GfK NOP Consumer Confidence (% balance) | -34 | -29 | -24 | -19 | -17 | -7 | -6 | -3 |
| Hometrack Weighted Average Price (GBP) | 170,500 | 172,200 | 173,100 | 174,100 | 174,400* | 174,867 | 165,725 | 161,592 |
| Hometrack Housing Price (M/M % change) | -0.99 | -0.52 | -0.57 | -0.17 | -0.17 | 5.52 | 2.56 | -2.38 |
| *Recent Peak 176,300 September 2007 | ||||||||
by Robert Brusca June 30, 2008
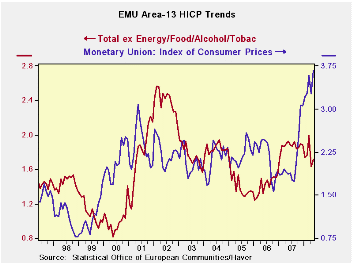
The EMU HICP is now over 4% Yr/Yr. this is not a good result
for a central bank that has set a ceiling of 2% for headline inflation.
It is also running at a pace of just over 4% over three-months and
six-months. No detail of prices is yet available and only Germany and
Italy have released public figures for June. The good news is that
neither Italy nor Germany show accelerating trends in headline
inflation. Their sequential growth rates are either mixed or pointing
lower. But at 4% Yr/Yr Italian inflation is high and a 3.6% Yr/Yr
German inflation, usually one of the lowest in the zone, is also high.
The ECB has an emerging credibility problem that will probably
force its hand on a rate hike. But one as to wonder the usefulness of a
target that is breached so baldy it has been doubled. While critics can
pick at the Fed’s choice of the core rate to ‘monitor’ it has set out
parameters for that rate’s range that US inflation still lies within.
The core is contained even as headline inflation in the US surges over
4%. The Fed can claim victory but many don’t want to acknowledge it.
Europe has a policy credibility issue inflation has been above
the ECB’s ceiling for far too along. In the US inflation is within the
Fed’s boundaries but it is the Fed choice of boundaries that is a
matter of debate concerning policy integrity. Central banks are having
all sorts of issues maintaining their standing despite the success in
holding core inflation low.
Still the fact is…
When oil prices flare so sharply, it is impossible to cushion the
impact on inflation in the short run. The ECB thus has a credibility
problem since its sole pledge is on headline inflation. It has not
offered any cogent statement on inflation or an alternative to headline
and has not suggested anything other than that inflation as it is
remains unacceptable. Energy inflation is something special, since if
the central bank can hold its impact on core inflation at bay it will
also produce deflationary effects. No central banks gets good marks for
their public relations stance in dealing with this issue in this cycle
despite having had prior experience with energy inflation.
| Trends in EMU HICP; Flash Index | |||||||
|---|---|---|---|---|---|---|---|
| % mo/mo | % SAAR | ||||||
| Jun-08 | May-08 | Apr-08 | 3-Mo | 6-Mo | 12-Mo | Yr Ago | |
| EMU-13 | 0.5% | 0.6% | 0.0% | 4.3% | 4.2% | 4.0% | 1.9% |
| Core | #N/A | 0.2% | -0.1% | 2.3% | 2.5% | 2.4% | 1.9% |
| Goods | #N/A | 0.8% | 0.6% | 11.8% | 5.3% | 4.5% | 1.4% |
| Services | #N/A | 0.4% | -0.1% | 2.6% | 3.7% | 2.5% | 2.6% |
| HICP | |||||||
| Germany | 0.5% | 0.6% | -0.4% | 2.7% | 3.2% | 3.4% | 2.0% |
| France | #N/A | 0.5% | 0.1% | 4.6% | 3.8% | 3.7% | 1.1% |
| Italy | 0.6% | 0.4% | 0.0% | 4.2% | 4.6% | 4.0% | 1.9% |
| Spain | #N/A | 0.7% | -0.1% | 4.1% | 4.3% | 4.7% | 2.4% |
| Core excl Food Energy & Alcohol | |||||||
| Germany | #N/A | 0.3% | -0.5% | 0.8% | 1.2% | 1.8% | 2.1% |
| France | #N/A | 0.1% | 0.1% | 2.4% | 2.6% | 2.4% | 1.4% |
| Italy | #N/A | 0.2% | -0.1% | 3.1% | 2.9% | 2.7% | 1.9% |
| Spain | #N/A | 0.3% | -0.1% | 2.2% | 2.7% | 3.3% | 2.5% |
| Blue shaded area data trail by one month | |||||||

Tom Moeller
AuthorMore in Author Profile »Prior to joining Haver Analytics in 2000, Mr. Moeller worked as the Economist at Chancellor Capital Management from 1985 to 1999. There, he developed comprehensive economic forecasts and interpreted economic data for equity and fixed income portfolio managers. Also at Chancellor, Mr. Moeller worked as an equity analyst and was responsible for researching and rating companies in the economically sensitive automobile and housing industries for investment in Chancellor’s equity portfolio. Prior to joining Chancellor, Mr. Moeller was an Economist at Citibank from 1979 to 1984. He also analyzed pricing behavior in the metals industry for the Council on Wage and Price Stability in Washington, D.C. In 1999, Mr. Moeller received the award for most accurate forecast from the Forecasters' Club of New York. From 1990 to 1992 he was President of the New York Association for Business Economists. Mr. Moeller earned an M.B.A. in Finance from Fordham University, where he graduated in 1987. He holds a Bachelor of Arts in Economics from George Washington University.
More Economy in Brief


