 Global| Sep 28 2009
Chicago Fed Index Lower Last MonthBut Trend Still Firm
by:Tom Moeller
|in:Economy in Brief
Summary
The Chicago Federal Reserve Bank reported that its National Activity Index slipped last month after having improved sharply from the January low. The reading of -0.90 was down from -0.56 during July but both figures were well improved [...]
 The Chicago Federal Reserve Bank reported that its National
Activity Index slipped last month after having improved sharply from
the January low. The reading of -0.90 was down from -0.56 during July
but both figures were well improved from the series' low of -4.13
reached this past January. Since 1970 there has been a 74% correlation
between the level of the index and the q/q change in real GDP but
during the last ten years that correlation has risen to 80%.
The Chicago Federal Reserve Bank reported that its National
Activity Index slipped last month after having improved sharply from
the January low. The reading of -0.90 was down from -0.56 during July
but both figures were well improved from the series' low of -4.13
reached this past January. Since 1970 there has been a 74% correlation
between the level of the index and the q/q change in real GDP but
during the last ten years that correlation has risen to 80%.
The three-month moving average which smoothes out some of the volatility of the index improved to its highest level since June of '08.
An index level at or below -0.70 typically has indicated negative U.S. economic growth. A zero value of the CFNAI indicates that the economy is expanding at its historical trend rate of growth of roughly 3%. The complete CFNAI report is available here.
The production and employment components made smaller positive
contributions to the August CFNAI than during July while the
consumption, housing, sales, orders and inventories categories
improved. Overall, thirty-one of the index components had a positive
influence while 54 made a negative contribution.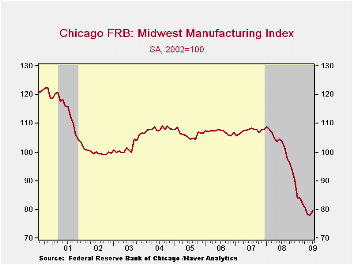
The CFNAI is a weighted average of 85 indicators of economic activity. The indicators reflect activity in the following categories: production & income, the labor market, personal consumption & housing, manufacturing & trade sales, and inventories & orders.
In a separate survey, the Chicago Fed indicated that its Midwest manufacturing index improved slightly during July but remained near its lowest since late-1993. Indicators for the auto sector improved but for the steel and machinery sectors the series fell to new cycle lows. The Chicago Federal Reserve figures are available in Haver's SURVEYS database.
Friday's speech by Fed Governor Kevin Warsh titled Longer Days, Fewer Weekends can be found here.
| Chicago Fed | August | July | August '08 | 2008 | 2007 | 2006 |
|---|---|---|---|---|---|---|
| CFNAI | -0.90 | -0.56 | -2.01 | -1.77 | -0.35 | 0.05 |
| 3-Month Moving Average | -1.09 | -1.61 | -1.42 | -- | -- | -- |
Italian Consumer Confidence Moves Sharply Higher
by Robert Brusca September 28, 2009
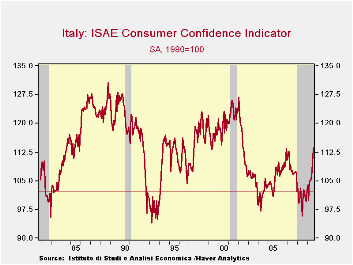 Getting better - Italian
consumer confidence rose sharply
higher in September. After bottoming in August of 2008, confidence made
a large 4.3point jump in August 2009 and in September of 2009 it has
added a further advance of 1.8 points. The rise in August had been the
13th largest monthly gain on record. Having another significant rise
(55th largest out of 215 total.) is a sign that the improvement has
legs. Now you have to go back to July of 2002 to find a higher reading
as the rise in September brings the consumer sentiment reading above
its previous local peak at end 2006.
Getting better - Italian
consumer confidence rose sharply
higher in September. After bottoming in August of 2008, confidence made
a large 4.3point jump in August 2009 and in September of 2009 it has
added a further advance of 1.8 points. The rise in August had been the
13th largest monthly gain on record. Having another significant rise
(55th largest out of 215 total.) is a sign that the improvement has
legs. Now you have to go back to July of 2002 to find a higher reading
as the rise in September brings the consumer sentiment reading above
its previous local peak at end 2006.
Upbeat on the future - Italians rate their confidence overall in the 79th percentile of its range since 1992 and better than the readings that are produced 62% of the time (its rank standing). Italian consumers now rate the overall situation as in the 77th percentile of its range at a raw reading of -58. Over the next twelve months (the raw reading is +6) but as a percentile it stands in the 69th percentile of its range. Note the difference in Italian consumers and their expectations. At a raw reading of -58 the overall situation is rated in the 77th percentile of its range a rather high percentile standing for such a sour (net!) negative reading. When it comes to looking ahead, however, the raw reading of +6 stands in the 69th percentile of its range, a roughly comparable relative position. Clearly this suggests that Italian consumes are prone to optimism. But the percentiles of course adjust for that; the raw readings do not, but they are instructive. It is interesting ant a people whose capital city is replete with ruins of its past greatness are able to shake off any semblance of an empire past and look so optimistically to the future.
Flies in the ointment or outlook - Unemployment, however, is still feared as the unemployment expectation reading is still in the 69th percentile of its range. The unemployment expectations worsened month to month with 23% (up from 20) worried that it might rise sharply. Those fearing a slight increase fell to 39% from 40%.. Stable unemployment is now expected by 28% up from 26%. But only 3% (down from 5%) of Italians think unemployment will fall. It’s an odd set of responses on unemployment prospects to occur is such another upbeat assessment of the future.
Upbeat on spending - The household financial situation was in the 46th percentile of its range over the past 12 months while expectations are in the 69th percentile over the next 12-months. The environment for making purchases is in the 42nd percentile while in the next twelve months it is expected to rise to the 96th percentile.
High hopes - Obviously for Italy hopes are high. Current measures have improved but there is still a lot that is wrong. For whatever reason Italian consumers have ratcheted up their expectations especially as to the future environment for making purchases. The news is good news, but it is heavily dependent on confidence, per se. While Germany seems to be getting more concerned about its future and the potential for unemployment to rise in Italy, glee over the outlook is spreading amid a still sour outlook for unemployment prospects. Still, the overall reading is at its best level since mid-2002.
| Italy ISAE Consumer Confidence | |||||||||||
|---|---|---|---|---|---|---|---|---|---|---|---|
| Since Jan 1992 | Rank | ||||||||||
| Sep 09 |
Aug 09 |
Jul 09 |
Jun 09 |
Percen tile |
Rank | Max | Min | Range | Mean | percen tile |
|
| Consumer Confidence | 113.6 | 111.8 | 107.5 | 105.5 | 59.8 | 79 | 127 | 94 | 33 | 110 | 62.9% |
| Last 12 months | |||||||||||
| OVERALL SITUATION |
-58 | -62 | -68 | -68 | 71.2 | 68 | -22 | -147 | 125 | -70 | 68.1% |
| PRICE TRENDS | -42 | -42 | -48 | -40.5 | 11.7 | 208 | 4 | -48 | 52 | -9 | 2.3% |
| Next 12months | |||||||||||
| OVERALL SITUATION |
5 | 1 | 2 | -8 | 69.8 | 12 | 24 | -39 | 63 | -9 | 94.4% |
| PRICE TRENDS | 9.5 | 7.5 | 1.5 | 8.5 | 19.4 | 92 | 49 | 0 | 49 | 11 | 56.8% |
| UNEMPLOYMENT | 17 | 11 | 8 | 15 | 69.1 | 7 | 38 | -30 | 68 | -1 | 96.7% |
| HOUSEHOLD BUDGET | 6 | 0 | 1 | 0 | 27.7 | 178 | 40 | -7 | 47 | 16 | 16.4% |
| HOUSEHOLD FIN SITUATION | |||||||||||
| Last 12 months | -33 | -34 | -40 | -37 | 46.9 | 89 | -7 | -56 | 49 | -31 | 58.2% |
| Next12 months | -1 | -2 | -2 | -4 | 69.4 | 86 | 14 | -35 | 49 | -3 | 59.6% |
| HOUSEHOLD SAVINGS | |||||||||||
| Current | 80 | 79 | 60 | 60 | 100.0 | 1 | 80 | 20 | 60 | 43 | 99.5% |
| Future | -16 | -21 | -30 | -25 | 68.1 | 106 | -1 | -48 | 47 | -19 | 50.2% |
| MAJOR Purchases | |||||||||||
| Current | -40 | -37 | -40 | -39 | 42.1 | 100 | -7 | -64 | 57 | -39 | 53.1% |
| Future | 4 | 4 | 4 | 3 | 96.8 | 3 | 7 | -87 | 94 | -64 | 98.6% |
| Total number of months: 213 | |||||||||||
Recession In Lithuania Bottoming?
by Louise Curley September 28, 2009
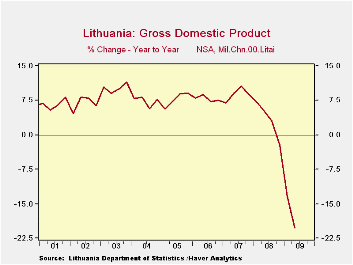 Along with the other
Baltics, Estonia and Latvia, Lithuania,
having pegged its currency to the Euro has been unable to devalue its
currency to gain a competitive advantage. Instead it has been forced to
deflate its economy with the result that it has suffered one of the
most severe recessions in the European Union. Real Gross Domestic
Along with the other
Baltics, Estonia and Latvia, Lithuania,
having pegged its currency to the Euro has been unable to devalue its
currency to gain a competitive advantage. Instead it has been forced to
deflate its economy with the result that it has suffered one of the
most severe recessions in the European Union. Real Gross Domestic
 Product was down 13.4% from
a year ago in the first quarter of this
year and was down 20.2% in the second quarter, as shown in the first
chart. The Central Bank Governor, Reinoldijus Sarkinas, reported
yesterday that the economy is close to bottoming out and could see some
growth next year, given positive external conditions. The one bright
spot in the Lithuanian economy has been the improvement in the balance
of payments in goods and services, as shown in the second chart..Data
released today on
retail sales show that although sales in August are 19.6% below a year
ago, they are slightly below the peak decline of 21.1%, as can be seen
in the third chart.
Product was down 13.4% from
a year ago in the first quarter of this
year and was down 20.2% in the second quarter, as shown in the first
chart. The Central Bank Governor, Reinoldijus Sarkinas, reported
yesterday that the economy is close to bottoming out and could see some
growth next year, given positive external conditions. The one bright
spot in the Lithuanian economy has been the improvement in the balance
of payments in goods and services, as shown in the second chart..Data
released today on
retail sales show that although sales in August are 19.6% below a year
ago, they are slightly below the peak decline of 21.1%, as can be seen
in the third chart.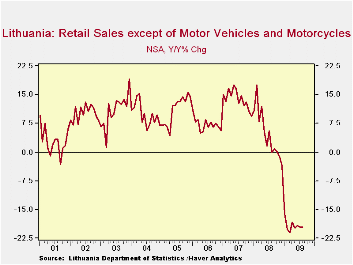 While not particularly encouraging, the decline is
not getting worse. The July data on manufacturing new orders are
somewhat more encouraging. While domestic orders have fallen more than
foreign order, they appear to be recovering faster than the foreign
orders as shown in the fourth chart.
While not particularly encouraging, the decline is
not getting worse. The July data on manufacturing new orders are
somewhat more encouraging. While domestic orders have fallen more than
foreign order, they appear to be recovering faster than the foreign
orders as shown in the fourth chart.
| Aug 09 | Jul 09 | Jun 09 | May 09 | APR 09 | Mar 09 | FEB 09 | Jan 09 | |
|---|---|---|---|---|---|---|---|---|
| Retail Trace ex motor vehicles and motorcycles | -19.6 | -19.6 | -19.2 | -19.8 | -18.4 | -21.1 | -20.0 | -16.2 |
| Manufacture 's New Orders | ||||||||
| Domestic (y/y %) | -38.64 | -38.00 | -41.48 | -47.16 | -43.15 | -47.93 | -41.38 | |
| Foreign (y/y %) | -38.41 | -42.37 | 37.44 | -36.45 | -30.95 | -24.55 | -34.75 |

Tom Moeller
AuthorMore in Author Profile »Prior to joining Haver Analytics in 2000, Mr. Moeller worked as the Economist at Chancellor Capital Management from 1985 to 1999. There, he developed comprehensive economic forecasts and interpreted economic data for equity and fixed income portfolio managers. Also at Chancellor, Mr. Moeller worked as an equity analyst and was responsible for researching and rating companies in the economically sensitive automobile and housing industries for investment in Chancellor’s equity portfolio. Prior to joining Chancellor, Mr. Moeller was an Economist at Citibank from 1979 to 1984. He also analyzed pricing behavior in the metals industry for the Council on Wage and Price Stability in Washington, D.C. In 1999, Mr. Moeller received the award for most accurate forecast from the Forecasters' Club of New York. From 1990 to 1992 he was President of the New York Association for Business Economists. Mr. Moeller earned an M.B.A. in Finance from Fordham University, where he graduated in 1987. He holds a Bachelor of Arts in Economics from George Washington University.
More Economy in Brief


