 Global| Apr 21 2008
Chicago Fed Index Indicates Recession
by:Tom Moeller
|in:Economy in Brief
Summary
The National Activity Index (CFNAI) for March, published by the Chicago Federal Reserve Bank, improved slightly to -0.78 from its low February reading of -1.28. Nevertheless, the recent level was near the lowest since early 2003 and [...]
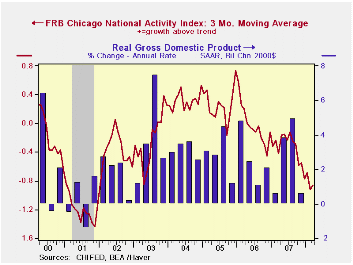
The National Activity Index (CFNAI) for March, published by the Chicago Federal Reserve Bank, improved slightly to -0.78 from its low February reading of -1.28. Nevertheless, the recent level was near the lowest since early 2003 and was just above the levels reached during the 2001 recession.
A zero value of the CFNAI indicates that the economy is expanding at its historical trend rate of growth of roughly 3%. During the last twenty years there has been a 68% correlation between the level of the CFNAI and q/q growth in real GDP. An index level at or below -0.70 typically has indicated negative U.S. economic growth.
The complete CFNAI report is available here and the historical data are available in Haver's Surveys database.
Each of the four broad categories of indicators — employment, production, consumption and housing — continued to make negative contributions to the CFNAI during March.
The CFNAI is a weighted average of 85 indicators of economic activity. The indicators reflect activity in the following categories: production & income, the labor market, personal consumption & housing, manufacturing & trade sales, and inventories & orders.
Economic Trends and the Chicago Fed National Activity Index from the Federal Reserve Bank of Chicago is available here.
Globalization and Inflation Dynamics: The Impact of Increased Competition from the Federal Reserve Bank of New York can be found here
| Chicago Fed | March | February | March '07 | 2007 | 2006 | 2005 |
|---|---|---|---|---|---|---|
| CFNAI | -0.78 | -1.28 | 0.05 | -0.42 | -0.05 | 0.26 |
| 3-Month Average | -0.86 | -0.92 | -0.41 | -0.34 | -0.03 | 0.26 |
by Louise Curley April 21, 2008
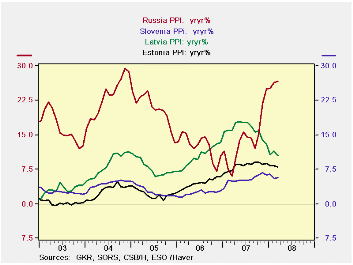
Four countries, Russia, Slovenia, Latvia and Estonia in Eastern Europe reported Producer Price Indexes (PPI) today. Except for Estonia where producer price inflation declined by 69 basis points in March, the other countries showed increases: in Slovenia, a rise of 17 basis points; in Latvia, a rise of 94 basis points and in Russia a rise of 230 basis points. The first chart shows producer price inflation in the four countries. While increases in producer price inflation have tended to moderate in Estonia, Latvia and Slovenia, the increase in Russia has accelerated. In March the producer price inflation, represented by the year to year rise in Russia's PPI was 26.6%, nearing the peak of 28.8% reached at the end of 2004 and well above producer price inflation in the other three countries.
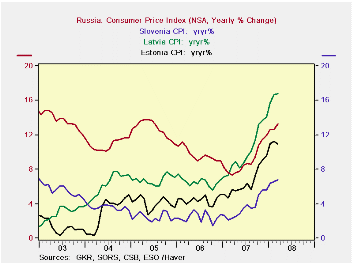
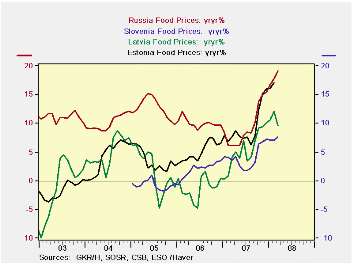
Earlier this month consumer price indexes (CPI) for these countries were released. Inflation at the consumer level, measured by the year to year changes in the CPI is shown in the second chart and noted in the table below. Consumer price inflation in all four countries has shown a similar rising trend since early 2007. In contrast to producer price inflation, it is Latvia where consumer price inflation is currently highest at 16.7% and Russia, second highest at 13.3%. So far in 2008, inflation at the consumer level has been higher than that at the producer level for all except Russia where producer inflation has been twice as high as consumer price inflation. The recent steep rise world in food prices may account for the relative greater increase in the consumer price index since food has a greater weight in the CPI than in the PPI. Like the rest of the world, these countries have seen record rises in food prices as shown in the third chart.
| PPI AND CPI INFLATION (%) | Mar 08 | Feb 08 | Mar 07 | M/M Chg | Y/Y Chg | 2007 | 2006 | 2005 |
|---|---|---|---|---|---|---|---|---|
| PPI INFLATION | ||||||||
| RUSSIA | 26.59 | 26.38 | 5.95 | 2.30 | 20.24 | 14.30 | 12.41 | 20.55 |
| SLOVENIA | 5.71 | 5.54 | 5.01 | 0.17 | 0.70 | 5.37 | 2.34 | 2.70 |
| LATVIA | 10.47 | 11.41 | 15.99 | 0.94 | 5.52 | 16.14 | 10.36 | 7.81 |
| ESTONIA | 7.98 | 8.29 | 7.30 | -0.69 | 0.68 | 8.27 | 4.48 | 2.11 |
| CPI INFLATION | ||||||||
| RUSSIA | 13.29 | 12.64 | 7.39 | 0.65 | 5.90 | 9.00 | 9.68 | 12.68 |
| SLOVENIA | 6.84 | 6.52 | 2.37 | 0.32 | 4.47 | 3.61 | 2.46 | 2.49 |
| LATVIA | 16.74 | 16.88 | 8.49 | -0.14 | 8.25 | 10.09 | 6.53 | 6.77 |
| ESTONIA | 10.94 | 11.26 | 5.71 | -0.32 | 5.23 | 1.60 | 4.43 | 4.09 |
by Robert Brusca April 21, 2008
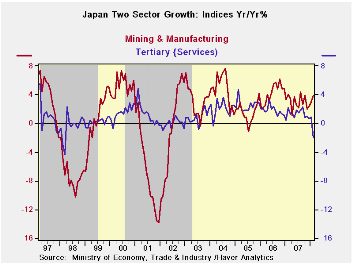
Japan’s MFG and services sectors diverged in February. The MFG
index stands at its highest level since 1993 and in growth terms
(chart) it is accelerating to a more midrange value. The services
sector (Japan’s tertiary Index) has, however, fallen sharply. While the
service index is still strong, residing in the 87th percentile of its
range, the drop in the index is sharp and worrisome. Even in recessions
the index does not usually drop this sharply.
| Up-to-date Japan Industry Surveys | ||||||||||
|---|---|---|---|---|---|---|---|---|---|---|
| Recent Months | Moving Averages | Extremes: Range | ||||||||
| Feb-2008 | Jan-2008 | Dec-2007 | 3-Mo | 6-Mo | 12-Mo | Max | Min | %-Tile | ||
| Mining and MFG | 110.2 | 108.5 | 109.1 | 109.3 | 109.0 | 108.0 | 110.2 | 87.0 | 100.0% | |
| Tertiary | 108.4 | 110.3 | 109.9 | 109.5 | 109.9 | 110.0 | 110.9 | 91.4 | 87.2% | |
| Ranges, Max, Min since 1993 | ||||||||||

Tom Moeller
AuthorMore in Author Profile »Prior to joining Haver Analytics in 2000, Mr. Moeller worked as the Economist at Chancellor Capital Management from 1985 to 1999. There, he developed comprehensive economic forecasts and interpreted economic data for equity and fixed income portfolio managers. Also at Chancellor, Mr. Moeller worked as an equity analyst and was responsible for researching and rating companies in the economically sensitive automobile and housing industries for investment in Chancellor’s equity portfolio. Prior to joining Chancellor, Mr. Moeller was an Economist at Citibank from 1979 to 1984. He also analyzed pricing behavior in the metals industry for the Council on Wage and Price Stability in Washington, D.C. In 1999, Mr. Moeller received the award for most accurate forecast from the Forecasters' Club of New York. From 1990 to 1992 he was President of the New York Association for Business Economists. Mr. Moeller earned an M.B.A. in Finance from Fordham University, where he graduated in 1987. He holds a Bachelor of Arts in Economics from George Washington University.
More Economy in Brief


