 Global| Jul 21 2008
Chicago Fed Index Improved Somewhat
by:Tom Moeller
|in:Economy in Brief
Summary
The Chicago Federal Reserve Bank indicated that its Chicago Fed National Activity Index (CFNAI) for June was again negative. The reading of -0.60 was, however, the least negative since January. It left the three-month moving average [...]
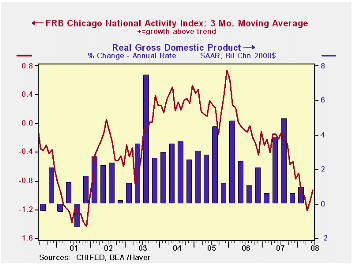
The Chicago Federal Reserve Bank indicated that its Chicago Fed National Activity Index (CFNAI) for June was again negative. The reading of -0.60 was, however, the least negative since January. It left the three-month moving average of the figure at -0.93, which also was its least negative since January.
An index level at or below -0.70 typically has indicated negative U.S. economic growth. A zero value of the CFNAI indicates that the economy is expanding at its historical trend rate of growth of roughly 3%. During the last twenty years there has been a 68% correlation between the level of the CFNAI and q/q growth in real GDP.
The complete CFNAI report is available here and the historical data are available in Haver's SURVEYS database.
The improvement in June again owed to production-related indicators. Employment, consumption and housing continued to make roughly the same negative contributions to the CFNAI during June.
Thirty-one of the of the eighty-five indicators in the index made positive contributions to the June index while 54 made negative contributions.
The CFNAI is a weighted average of 85 indicators of economic activity. The indicators reflect activity in the following categories: production & income, the labor market, personal consumption & housing, manufacturing & trade sales, and inventories & orders.
Are inflation targets good inflation forecasts? from the Federal Reserve Bank of Chicago can be found here.
Monetary Policy's Third Interest Rate from the Federal Reserve Bank of St. Louis is available here.
| Chicago Fed | June | May | June '07 | 2007 | 2006 | 2005 |
|---|---|---|---|---|---|---|
| CFNAI | -0.60 | -1.06 | -0.19 | -0.42 | -0.05 | 0.26 |
| 3-Month Average | -0.93 | -1.08 | -0.22 |
by Tom Moeller July 21, 2008
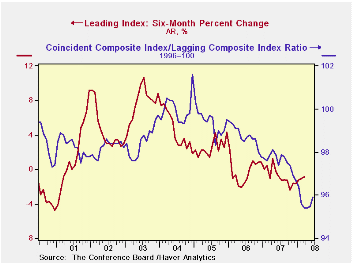
The composite index of leading economic indicators, reported by the Conference Board, dipped 0.1% during June after a revised 0.2% decline in May. The decline lowered the leaders by 0.9% so far in 2008.
The leaders still may not yet indicate that the U.S. economy is entering recession. Since their peak in early 2006, the leading index has fallen 2.9%. Prior to the recession of 2001 the leading index declined a greater 3.7% over a shorter, roughly ten month span.
During the last ten years there has been a 59% correlation between the y/y change in the leading indicators index and the lagged change in real GDP.
The breadth of one month increase amongst the leaders' 10 components improved slightly to 40% from 30% in May. Over a six month period the breadth of gain amongst the leaders' components held steady for the fourth month at a low 30%.
Last month higher claims for unemployment insurance, lower stock prices and a lower real money supply made the largest negative contributions to the leaders' decline. These were offset by improved new orders for consumer goods and higher building permits which made the largest positive contributions.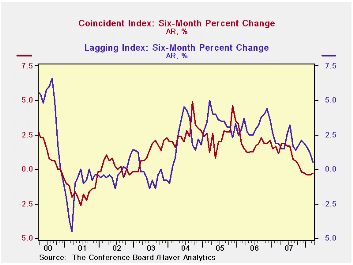
The method of calculating the contribution to the leading index from the spread between 10 year Treasury securities and the Fed funds rate was revised. A negative contribution will now occur only when the spread inverts rather than when declining as in the past. More details can be found here.
The leading index is based on eight previously reported economic data series. Two series, orders for consumer goods and orders for capital goods, are estimated.
The coincident indicators rose 0.1% and recovered their 0.1% May downtick. Most of the coincident series' components rose last month and over the last six months half were up and half were down. So far this year the series is down 0.3%. Declines of 1% to 2% have been associated with past recessions. Over the last ten years there has been an 86% correlation between the y/y change in the coincident indicators and real GDP growth.
The lagging index fell 0.3% after declines during the prior two months. The 0.5% recent rate of increase in the index is much reduced from the 2.0% to 3.5% growth rates during the past four years. The ratio of coincident to lagging indicators (a measure of economic excess) ticked up slightly but remained near its lowest level since early 1991. Visit the Conference Board's site for coverage of leading indicator series from around the world. Mortgage Originations: 2000-2006 from the Federal Reserve Bank of St. Louis can be found here.Why Are Exchange Rates So Difficult to Predict? from the Federal Reserve Bank of Dallas is available here.
| Business Cycle Indicators | June | May | March, 6 Month % (AR) | 2007 | 2006 | 2005 |
|---|---|---|---|---|---|---|
| Leading | -0.1% | -0.2% | -0.9% | -0.4% | 1.3% | 2.7% |
| Coincident | 0.1% | -0.1% | -0.3% | 1.7% | 2.4% | 2.5% |
| Lagging | -0.3% | -0.2% | 0.5% | 2.9% | 3.1% | 3.1% |
by Louise Curley July 21, 2008
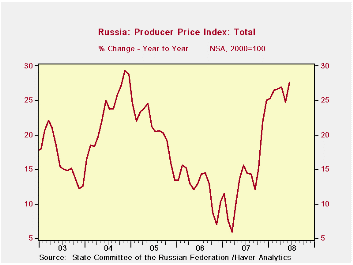
Five countries, Portugal, Switzerland, Russia, Estonia and Slovenia, reported June data for producer price indexes today.Among the five countries, inflation at the producer level measured by the year-over-year increase in the producer price index remains highest in Russia where the year-to-year increase in the producer price index rose to 27.6% in June from 24.7% in May and is now at its highest level since December 2004 as can be seen in the first chart.
The other four countries show producer price inflation low in comparison with Russia, but generally high and rising in comparison with their own recent experiences, as shown in the second chart. Estonia is the exception with inflation declining from the peak of 9.11% reached in October, 2007 to 7.45% in June, 2008.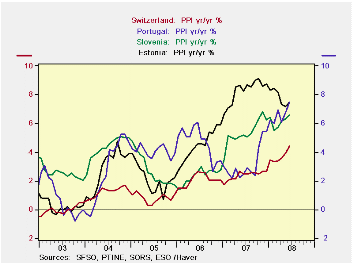
For Portugal and Slovenia, members of the Euro Area, their producer price inflation rates--at 7.5% for Portugal and 6.6% for Slovenia--are among the highest rates in the Euro Area. Switzerland stands out with the lowest producer price inflation rate, 4.4%, of the group.
| PRODUCER PRICE INFLATION (%) | Jun 08 | May 08 | Apr 08 | Mar 08 | Feb 08 | Jan 08 | 2007 | 2006 |
|---|---|---|---|---|---|---|---|---|
| Russia | 27.64 | 24.71 | 26.91 | 26.66 | 26.42 | 25.23 | 14.0 | 12.41 |
| Estonia | 7.45 | 7.18 | 7.33 | 8.14 | 8.43 | 8.32 | 8.27 | 4.48 |
| Slovenia | 6.59 | 6.33 | 6.16 | 5.71 | 5.54 | 6.42 | 5.37 | 2.34 |
| Portugal | 7.47 | 6.74 | 6.10 | 6.95 | 6.02 | 6.21 | 3.19 | 4.68 |
| Switzerland | 4.39 | 3.93 | 3.58 | 3.42 | 3.33 | 3.44 | 2.36 | 2.05 |

Tom Moeller
AuthorMore in Author Profile »Prior to joining Haver Analytics in 2000, Mr. Moeller worked as the Economist at Chancellor Capital Management from 1985 to 1999. There, he developed comprehensive economic forecasts and interpreted economic data for equity and fixed income portfolio managers. Also at Chancellor, Mr. Moeller worked as an equity analyst and was responsible for researching and rating companies in the economically sensitive automobile and housing industries for investment in Chancellor’s equity portfolio. Prior to joining Chancellor, Mr. Moeller was an Economist at Citibank from 1979 to 1984. He also analyzed pricing behavior in the metals industry for the Council on Wage and Price Stability in Washington, D.C. In 1999, Mr. Moeller received the award for most accurate forecast from the Forecasters' Club of New York. From 1990 to 1992 he was President of the New York Association for Business Economists. Mr. Moeller earned an M.B.A. in Finance from Fordham University, where he graduated in 1987. He holds a Bachelor of Arts in Economics from George Washington University.
More Economy in Brief


