 Global| Sep 22 2008
Chicago Fed Index At Recession Level
by:Tom Moeller
|in:Economy in Brief
Summary
The August National Activity Index (CFNAI) from the Chicago Federal Reserve Bank dropped sharply from July. The reading of -1.59 was its lowest level since the last recession during 2001.The current index level was then associated [...]
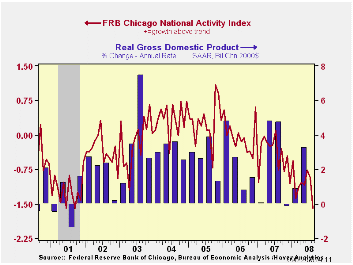
The August National Activity Index (CFNAI) from the Chicago Federal Reserve Bank dropped sharply from July. The reading of -1.59 was its lowest level since the last recession during 2001.The current index level was then associated with -1.4% (AR) growth in quarterly real GDP.
The three-month moving average of the index also fell, but the drop was more moderate to -1.09 from -0.92 during July. The latest figure was exceeded, to the downside, during April.
An index level at or below -0.70 typically has indicated negative U.S. economic growth. A zero value of the CFNAI indicates that the economy is expanding at its historical trend rate of growth of roughly 3%. During the last twenty years there has been a 68% correlation between the level of the CFNAI and q/q growth in real GDP.
The complete CFNAI report is available here and the historical data are available in Haver's SURVEYS database.
All of the categories of the August index were indicated to
have made negative contribution to the total during August, but the
largest came from the production figures.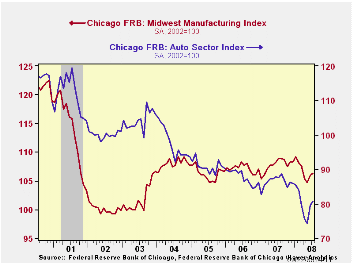
Inflationary pressure also was indicated to be low for the coming year.
The CFNAI is a weighted average of 85 indicators of economic activity. The indicators reflect activity in the following categories: production & income, the labor market, personal consumption & housing, manufacturing & trade sales, and inventories & orders.
In a separate survey, the Chicago Fed indicated that its Midwest manufacturing index improved again. The July index level was at its highest since this past March. Each of the component series, for the auto sector, machinery and resource sectors, rose and offset deterioration the steel sector index.
The U.S. Economic Situation and the Challenges for Monetary Policy is adapted from speeches made by San Francisco Fed Janet Yellen and it can be found here.
| Chicago Fed | August | July | August '07 | 2007 | 2006 | 2005 |
|---|---|---|---|---|---|---|
| CFNAI | -1.59 | -0.93 | -0.76 | -0.43 | -0.03 | 0.27 |
| 3-Month Average | -1.09 | -0.92 | -0.30 |
by Louise Curley September 22, 2008
In some of the past financial crises, one could limit risks by
diversifying into emerging markets. Over the past several weeks,
however, the stock markets in many of the emerging countries have
suffered the same fate as that of the developed countries. The first
chart shows the year-to-year changes in the daily stock prices of four
emerging markets--Argentina, the Czech Republic, Turkey and Hong Kong.
These data are taken from Haver Analytics' INTDAILY
database.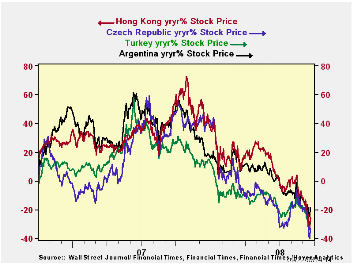
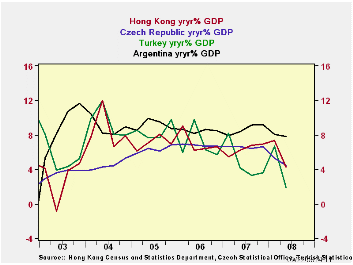
Not only have the stock price changes in the emerging markets shown a higher correlation with those of the developed countries, growth in many emerging market countries has also begun to show a higher correlation with that of the developed countries. The second chart shows the year-to-year percent changes in real GDP in the same four countries. Each country is from one of the different geographic areas represented in the Haver Analytics' Emerging Markets databases. Data for Argentina are from the database EMERGELA covering Latin America, the Czech Republic from the EMERGECW database covering Central and Eastern Europe and Western Asia, Turkey from the EMERGEMA database covering the Middle East and Africa and Hong Kong from the EMERGEPR database covering Asia Pacific.(Data for Argentina, Turkey, and the Czech Republic were released earlier this month; that for Hong Kong was released today.)
| EMERGING MARKETS | Q2 2008 | Q1 2008 | Q4 2007 | Q3 2007 | Q2 2007 | Q1 2007 |
|---|---|---|---|---|---|---|
| Y/Y Growth in GDP | ||||||
| Argentina | 7.79 | 8.05 | 9.16 | 9.12 | 8.36 | 7.93 |
| Czech Republic | 4.53 | 5.33 | 6.60 | 6.45 | 6.64 | 6.61 |
| Turkey | 1.92 | 6.71 | 3.59 | 3.26 | 4.14 | 8.11 |
| Hong Kong | 4.23 | 7.34 | 6.90 | 6.75 | 6.22 | 5.47 |
| Percent Change in Stock Price from Year Ago | 9/19 /08 | |||||
| Argentina | -18.6 | |||||
| Czech Republic | -32.5 | |||||
| Turkey | -26.6 | |||||
| Hong Kong | -25.2 | |||||
by Robert Brusca September 22, 2008
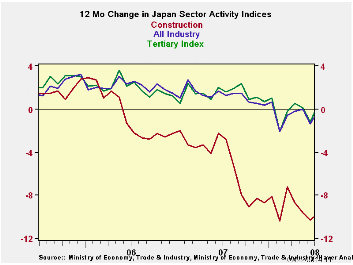
Japan’s all-industries index and tertiary index are up in the month and still very high in their historic ranges going back to the early 1990s. By contrast the construction sector is extremely weak with little evidence of any resilience. Despite the bounce in the month for the all-industry index and for the services sector (tertiary index) both seem to be still in a cyclical slide. The indices bottomed in this cycle in February of this year. It is still not clear what trajectory these two sectors are on. Japan’s economy is still under stress.
| Up to date Japan Industry Surveys | |||||||||
|---|---|---|---|---|---|---|---|---|---|
| Recent Months | Moving Averages | Extremes; Range | |||||||
| Jul 2008 |
Jun 2008 |
May 2008 |
3Mo | 6Mo | 12Mo | Max | Min | %-Tile | |
| All Industry | 107.3 | 106.4 | 107.5 | 107.1 | 106.7 | 107.1 | 108.1 | 93.9 | 94.4% |
| Construction | 68.8 | 69.7 | 70.5 | 69.7 | 70.7 | 71.7 | 122.3 | 68.8 | 0.0% |
| Tertiary | 110.6 | 109.3 | 110.4 | 110.1 | 109.7 | 110.0 | 110.9 | 92.0 | 98.4% |
| Ranges, Max, Min since 1993 | |||||||||

Tom Moeller
AuthorMore in Author Profile »Prior to joining Haver Analytics in 2000, Mr. Moeller worked as the Economist at Chancellor Capital Management from 1985 to 1999. There, he developed comprehensive economic forecasts and interpreted economic data for equity and fixed income portfolio managers. Also at Chancellor, Mr. Moeller worked as an equity analyst and was responsible for researching and rating companies in the economically sensitive automobile and housing industries for investment in Chancellor’s equity portfolio. Prior to joining Chancellor, Mr. Moeller was an Economist at Citibank from 1979 to 1984. He also analyzed pricing behavior in the metals industry for the Council on Wage and Price Stability in Washington, D.C. In 1999, Mr. Moeller received the award for most accurate forecast from the Forecasters' Club of New York. From 1990 to 1992 he was President of the New York Association for Business Economists. Mr. Moeller earned an M.B.A. in Finance from Fordham University, where he graduated in 1987. He holds a Bachelor of Arts in Economics from George Washington University.
More Economy in Brief


