 Global| Oct 03 2006
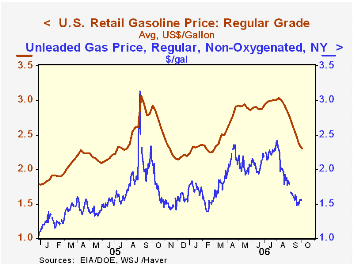
Chain Store Sales & Gasoline Prices Fell Again
by:Tom Moeller
|in:Economy in Brief
Summary
The International Council of Shopping Centers (ICSC)-UBS indicated that chain store sales fell last week. The 0.3% decline was the fourth drop in as many weeks and pulled the average of sales in September 0.5% below August.
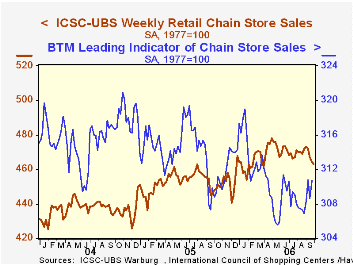
The ICSC-UBS retail chain-store sales index is constructed using the same-store sales (stores open for one year) reported by 78 stores of seven retailers: Dayton Hudson, Federated, Kmart, May, J.C. Penney, Sears and Wal-Mart.
The leading indicator of chain store sales from ICSC-UBS reversed all of the prior week's decline with a 0.7% rise, the third gain in the last four weeks. The indicator in September rose 0.7% from the August average, the first m/m rise since June. The latest Short-Term Energy Outlook from the U.S. Energy Information Administration is available here.Consumer Confidence Surveys: Can They Help Us Forecast Consumer Spending in Real Time? from the Federal Reserve Bank of Philadelphia is available here.
| ICSC-UBS (SA, 1977=100) | 09/30/06 | 09/23/06 | Y/Y | 2005 | 2004 | 2003 |
|---|---|---|---|---|---|---|
| Total Weekly Chain Store Sales | 463.0 | 464.2 | 3.3% | 3.6% | 4.7% | 2.9% |
by Tom Moeller October 3, 2006
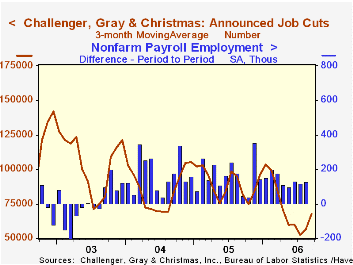
For September, announced job cuts reported by Challenger, Grey & Christmas jumped for the second month. The 35,037 increase to 100,315 was to the highest level since January. The three month moving average of layoff announcements also rose 19.5% to its highest level since April.
During the last ten years there has been an 83% (inverse) correlation between the three month moving average level of announced job cuts and the three month change payroll employment.
A sharply higher level of layoffs in automotive (464.2% y/y), commodities (77.2% y/y), consumer goods (9.5% y/y), industrial goods (-16.1% y/y), and insurance (396.0% y/y) boosted the total. These were offset by declines in retail (-82.7% y/y), financial (-26.5% y/y), real estate and transportation (-90.8% y/y).
Job cut announcements differ from layoffs. Many are achieved through attrition, early retirement or just never occur.
Challenger also reported that announced hiring plans more than tripled m/m (87.9% y/y).
Remarks by Fed Governor Randall S. Kroszner titled What Drives Productivity Growth? Implications for the Economy and Prospects for the Future can be found here.
| Challenger, Gray & Christmas | September | August | Y/Y | 2005 | 2004 | 2003 |
|---|---|---|---|---|---|---|
| Announced Job Cuts | 100,315 | 65,278 | 39.6% | 1,072,054 | 1,039,935 | 1,236,426 |
by Louise Curley October 3, 2006
Comparisons of retail sales among countries are beset by different definitions and by different units. Some countries report sales only in index form, others only in their national currencies. Some countries include sales of motor vehicle and parts; others do not. Some counties report sales both including and excluding motor vehicles and parts.
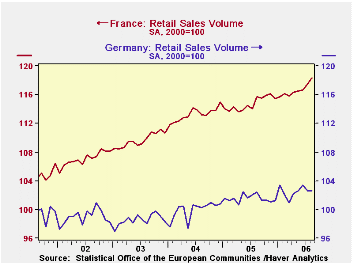
Today three countries--France, Australia and Hong Kong--reported retail sales. Yesterday Germany reported. The easiest comparison to make is between Germany and France. The volume of retail sales is reported in the EUROSTAT data base where concepts are harmonized. One can be reasonably certain that the difference in trends of retail sales in the two countries, shown in Chart 1, is a substantive one and not due to statistical quirks.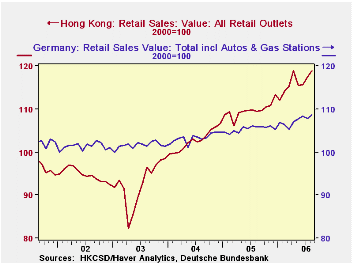
If one wishes to compare retail sales in Germany with those in Hong Kong one should note that the German concept excludes motor vehicles and parts while the Hong Kong concept includes them. Fortunately, however in the GERMANY data base, there is a memorandum item--Retail Sales including motor vehicle and parts. This series has a base of 2003 and the retail sales series in Hong Kong from the EMERGEPR data base has a base of October, 2004-September, 2005. One could change the Hong Kong index to base 2003=100 or, as we did change both to 2000=100 to be comparable with the other charts. The two series with base 2000=100 are shown in Chart 2.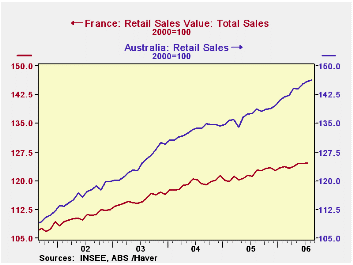
Another problem comes up when one series is in local currency and another in index form. Such is the case if one want to compare retail sales in France and Australia. The Australian data are given in millions of Australian Dollars, while the French data are given in terms of value and volume indexes. Both concepts, fortunately, exclude motor vehicles and parts. One simple approach is to take the Australian data from the ANZ data base, and, by using the advanced function, put the data in index form with 2000=100, the same base as the French value index that is found in the FRANCE data base.This comparison is shown in Chart 3.
The second and third charts, like the first show comparisons that reflect substantive differences and not statistical quirks.
| Retail Sales | Aug 06 | Jul 06 | Aug 05 | M/M % | Y/Y % | 2005 | 2004 | 2003 |
|---|---|---|---|---|---|---|---|---|
| GERMANY | ||||||||
| Vol Retail Sales, ex motor vehicles & pts (2000=100) | 104.3 | 104.3 | 104.1 | 0.00 | 0.19 | 103.2 | 101.6 | 100.2 |
| Val Retail Sales, ex motor vehicles & pts (2000=100) | 105.6 | 105.5 | 104.5 | 0.09 | 1.05 | 103.7 | 101.6 | 100.2 |
| Val Retail Sales, incl motor vehicles & pts (2000=100) | 107.1 | 106.3 | 104.4 | 0.75 | 2.59 | 103.9 | 101.8 | 100.2 |
| FRANCE | ||||||||
| Val Retail Sales, ex motor vehicles & pts (2000=100) | 116.3 | 116.1 | 114.1 | 0.68 | 2.25 | 114.7 | 113.2 | 109.7 |
| Vol Retail Sales, ex motor vehicles & pts (2000=100) | n.a. | 123.5 | 120.6 | n.a | n.a | 121.3 | 119.3 | 115.0 |
| AUSTRALIA | ||||||||
| Retail Sales (Mil A$) | 18.176 | 18031 | 17212.3 | 0.25 | 5.60 | 217396 | 198214 | 175956 |
| Retail Sales 2000=100) | 146.4 | 146.0 | 138.6 | 0.25 | 5.60 | 137.2 | 133.1 | 124.5 vA |
| HONG KONG | ||||||||
| Val Retail Sales (2000=100) | 118.8 | 117.4 | 109.4 | 1.20 | 8.61 | 109.6 | 102.7 | 92.6 |
Tom Moeller
AuthorMore in Author Profile »Prior to joining Haver Analytics in 2000, Mr. Moeller worked as the Economist at Chancellor Capital Management from 1985 to 1999. There, he developed comprehensive economic forecasts and interpreted economic data for equity and fixed income portfolio managers. Also at Chancellor, Mr. Moeller worked as an equity analyst and was responsible for researching and rating companies in the economically sensitive automobile and housing industries for investment in Chancellor’s equity portfolio. Prior to joining Chancellor, Mr. Moeller was an Economist at Citibank from 1979 to 1984. He also analyzed pricing behavior in the metals industry for the Council on Wage and Price Stability in Washington, D.C. In 1999, Mr. Moeller received the award for most accurate forecast from the Forecasters' Club of New York. From 1990 to 1992 he was President of the New York Association for Business Economists. Mr. Moeller earned an M.B.A. in Finance from Fordham University, where he graduated in 1987. He holds a Bachelor of Arts in Economics from George Washington University.
More Economy in Brief
 Global| Feb 05 2026
Charts of the Week: Balanced Policy, Resilient Data and AI Narratives
by:Andrew Cates


