 Global| Jul 05 2006
Chain Store Sales Fell Again, Gasoline Prices Rose
by:Tom Moeller
|in:Economy in Brief
Summary
The International Council of Shopping Centers (ICSC)-UBS reported that chain store sales fell another 0.7% last week following a 0.4% slip the prior period. Sales for all of June fell 0.4% from the May average which fell 0.4% from [...]
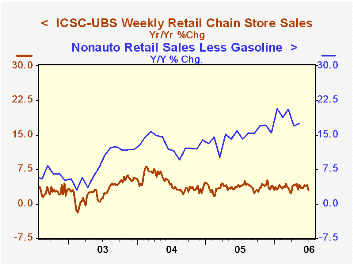
The International Council of Shopping Centers (ICSC)-UBS reported that chain store sales fell another 0.7% last week following a 0.4% slip the prior period.
Sales for all of June fell 0.4% from the May average which fell 0.4% from April. During the last ten years there has been a 47% correlation between the y/y change in chain store sales and the change in nonauto retail sales less gasoline.The ICSC-UBS retail chain-store sales index is constructed using the same-store sales (stores open for one year) reported by 78 stores of seven retailers: Dayton Hudson, Federated, Kmart, May, J.C. Penney, Sears and Wal-Mart.
The leading indicator of chain store sales from ICSC-UBS fell 0.3% (-2.7% y/y) for the second consecutive week.
The Seasonal Cycle and the Business Cycle from the Federal reserve Bank of St. Louis can be found here.
Retail gasoline prices rose seven cents in the opening week of July to an average $2.93 per gallon (31.8% y/y).
| ICSC-UBS (SA, 1977=100) | 06/31/06 | 06/24/06 | Y/Y | 2005 | 2004 | 2003 |
|---|---|---|---|---|---|---|
| Total Weekly Chain Store Sales | 468.3 | 473.6 | 2.9% | 3.6% | 4.7% | 2.9% |
by Tom Moeller July 5, 2006
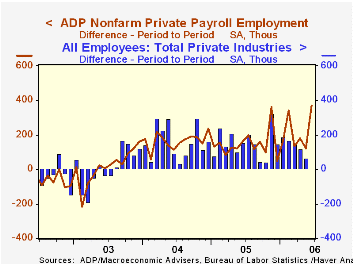
The Nat'l Employment Report published by ADP, the payroll processors for many employers, indicated that private nonfarm payrolls in June rose 368,000. The rise was the strongest increase in the brief history of the survey.
For the prior month the increase in ADP's measure of private nonfarm payrolls of 122,000 was accompanied by a meager 67,000 rise in May private nonfarm payrolls as published by the Bureau of Labor Statistics. The June figure from BLS will be published this Friday.
ADP has compiled the estimate from its database of individual companies' payroll information. Macroeconomic Advisers, LLC, the St. Louis economic consulting firm, developed the methodology for transforming the raw data into an economic indicator.
According to ADP and Macro Advisers, the correlation between the monthly percentage change in the ADP estimate and that in the BLS data is 0.90.
The ADP National Employment Report data is maintained in Haver's USECON database; historical data go back to December 2000. The figures in this report cover only private sector jobs and exclude employment in the public sector, which grew an average of 11,333 per month over the last year.
The full ADP National Employment Report can be found here, and the ADP methodology is explained here.
| LAXEPA@USECON | June | May | Y/Y | 2005 | 2004 | 2003 |
|---|---|---|---|---|---|---|
| Nonfarm Private Payroll Employment (Chg.) | 368,000 | 122,000 | 2.1% | 1.7% | 1.3% | -0.4% |
by Tom Moeller July 5, 2006
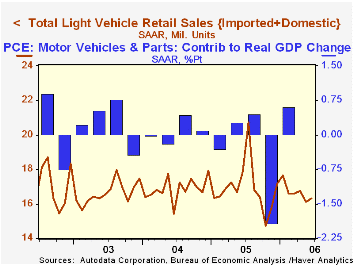
US light vehicle sales in June rose 1.3% m/m to 16.30M units and recaptured a piece of the prior month's 3.9% drop, according to the Autodata Corporation. Consensus expectations had been for sales of 16.4M units.
Overall light truck sales rose 3.6% (-17.2% y/y) last month as sales of imported light trucks rose 2.3% m/m (5.1% y/y) and domestic truck sales recovered all of the prior month's decline with a 3.9% rise (-20.2% y/y).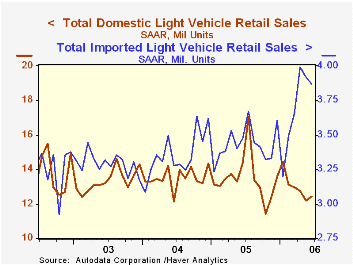
Auto sales slipped for the second consecutive month in June with a 1.2% decline (+3.1% y/y). Domestic car sales fell 0.2% (-1.8% y/y) while sales of imported autos fell 3.1% (+14.7% y/y).
Imports' share of the US light vehicle market slipped to 23.7% from a record 24.5% during May but remained up versus 20.4% during all of last year.
| Light Vehicle Sales (SAAR, Mil. Units) | June | May | Y/Y | 2005 | 2004 | 2003 |
|---|---|---|---|---|---|---|
| Total | 16.30 | 16.10 | -8.7% | 16.92 | 16.87 | 16.63 |
| Autos | 7.69 | 7.79 | 3.1% | 7.65 | 7.49 | 7.62 |
| Trucks | 8.61 | 8.31 | -17.2% | 9.27 | 9.37 | 9.01 |
by Carol Stone July 5, 2006
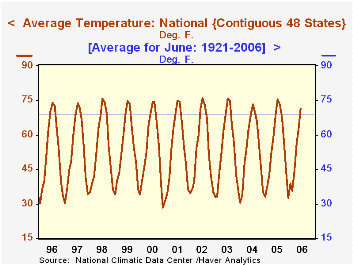
The national average temperature in June was 71.4°F, up 1.8° from last June and 2.25° higher than the average of the last 86 years. In that 86- year span, only 1933 saw a higher June figure, 72.0°, although several years have been above 71.0°.
Rainfall was a little short this June, and although not nearly a record low, was much less than the last several years. The national average amount was 2.58", compared with 3.15" in June 2005 and 3.52" in June 2004. These were relatively wet times, though, as seen in the table below, with an average since 1921 of 2.92".
These data come from the National Climatic Data Center, a branch of the Commerce Department in the division known as the National Oceanic and Atmospheric Administration. The National Weather Service is another part of the same Administration. Haver maintains temperature and precipitation by region and state in our REGIONAL database and the national averages are in USECON.
In assessing these data, we made use of some tools in Excel along with the DLX add-in for Excel. Copying codes into a spreadsheet is really easy with the latest versions of DLXVG3. Putting it in "Excel mode" leaves the menus visible. In Excel, we place the cursor in the cell where the first code will appear. In DLXVG3, we highlight the menu item we want, or to get a whole list, we can just click to the left of the first menu item we want and paint down the list as far as needed. Magically (seemingly), the codes and the database name will appear in the spreadsheet.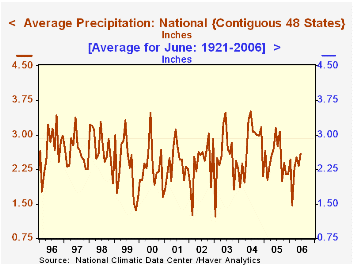
Instead of the typical date-span entry, we begin to enter the dates manually: for June of each year, we would type in 192106 and 192206. Then, we highlight those cells, grab the box on the corner and drag it down as far as needed. Excel will see the pattern in the dates and replicate it all the way down the column. In setting the range, we'll need to highlight the entire area covering the columns of codenames and the rows of dates. Then when we retrieve the data we'll have June of each year for 86 years for whichever items are of interest to us.
For instance, I retrieved temperatures for the nine special weather regions and used Excel functions to find the maximum, minimum, median and mean. A quick look at these figures and the bottom row of data shows that only one region, the West, set a new temperature record in June, but seven of the nine regions had above-average temperatures for the month. The maximums for each show that most records occurred many years ago: three in the early 1950s, one in 1943 and one in 1933, the same year as the national record. Besides the West, recent records were in the Southwest in 2002 and in the West North Central states in 1988.
| June Weather | June 2006 | June 2005 | June 2004 | Averages for Junes||||
|---|---|---|---|---|---|---|---|
| 2001-2006 | 1976-2000 | 1951-1975 | 1921-2006 | ||||
| Temperature (degrees F) | 71.4 | 69.6 | 68.5 | 69.78 | 69.24 | 68.26 | 69.15 |
| Precipitation (inches) | 2.58 | 3.15 | 3.52 | 3.07 | 2.93 | 2.85 | 2.92 |
Tom Moeller
AuthorMore in Author Profile »Prior to joining Haver Analytics in 2000, Mr. Moeller worked as the Economist at Chancellor Capital Management from 1985 to 1999. There, he developed comprehensive economic forecasts and interpreted economic data for equity and fixed income portfolio managers. Also at Chancellor, Mr. Moeller worked as an equity analyst and was responsible for researching and rating companies in the economically sensitive automobile and housing industries for investment in Chancellor’s equity portfolio. Prior to joining Chancellor, Mr. Moeller was an Economist at Citibank from 1979 to 1984. He also analyzed pricing behavior in the metals industry for the Council on Wage and Price Stability in Washington, D.C. In 1999, Mr. Moeller received the award for most accurate forecast from the Forecasters' Club of New York. From 1990 to 1992 he was President of the New York Association for Business Economists. Mr. Moeller earned an M.B.A. in Finance from Fordham University, where he graduated in 1987. He holds a Bachelor of Arts in Economics from George Washington University.
More Economy in Brief
 Global| Feb 05 2026
Charts of the Week: Balanced Policy, Resilient Data and AI Narratives
by:Andrew Cates


