 Global| May 23 2006
Chain Store Sales Down Again With Gasoline Prices
by:Tom Moeller
|in:Economy in Brief
Summary
Chain store sales dropped last week for the second week in the last three reported the International Council of Shopping Centers (ICSC)-UBS. The 0.8% w/w decline followed an unchanged level the prior period and a 0.4% dip to open the [...]
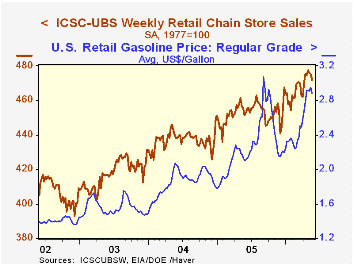
Chain store sales dropped last week for the second week in the last three reported the International Council of Shopping Centers (ICSC)-UBS. The 0.8% w/w decline followed an unchanged level the prior period and a 0.4% dip to open the month.
In May, sales on average are roughly even with the April average which rose 1.6% from March. During the last ten years there has been a 47% correlation between the y/y change in chain store sales and the change in nonauto retail sales less gasoline.The ICSC-UBS retail chain-store sales index is constructed using the same-store sales (stores open for one year) reported by 78 stores of seven retailers: Dayton Hudson, Federated, Kmart, May, J.C. Penney, Sears and Wal-Mart.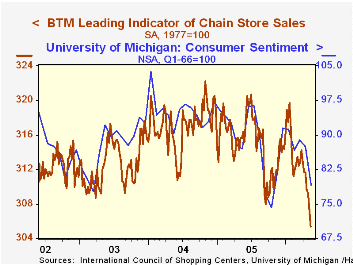
The latest leading indicator of chain chain store sales from ICSC-UBS fell for the fourth straight week. The 0.6% decline pulled the indicator down 2.7% versus one year ago and 4.5% from the recent peak in early January.
Lower chain store sales accompanied a six cent drop in retail gasoline prices to $2.88 per gallon. Nevertheless, average gasoline prices this month are up seventeen cents from April at $2.91 (34.8% y/y). Yesterday gasoline prices in the NY spot market recovered to the highest level in four days but spot prices this month have averaged roughly ten cents below the April level.
The NOAA: 2006 Atlantic Hurricane Outlook released yesterday can be found here.
The latest Short-Term Energy Outlook from the US Energy Information Administration is available here.
| ICSC-UBS (SA, 1977=100) | 05/20/06 | 05/13/06 | Y/Y | 2005 | 2004 | 2003 |
|---|---|---|---|---|---|---|
| Total Weekly Chain Store Sales | 472.0 | 475.7 | 3.5% | 3.6% | 4.7% | 2.9% |
by Louise Curley May 23, 2006
Several confidence indicators were released today--consumer and business indicators for the Netherlands and Slovenia, consumer confidence for Italy and business confidence for France.
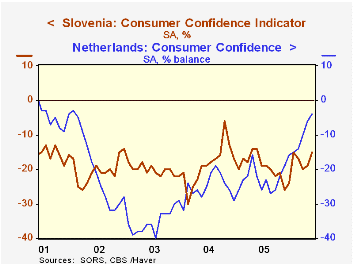
Consumer confidence rose in both the Netherlands and in Slovenia in May, but confidence remains weak in both countries.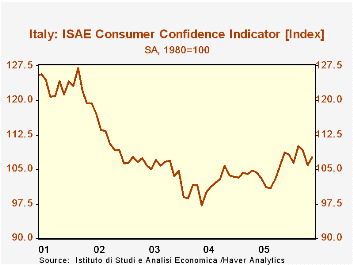 Pessimists continue to outweigh optimists. In the Netherlands the excess of pessimists declined from 6% to 4%, while in Slovenia, the comparable figures were 19% and 15%. The first chart shows consumer confidence in the Netherlands and Slovenia, expressed as the percent balance between pessimists and optimists. Consumers in Italy also were slightly more optimistic in May than in April. The ISAE (Instituto de Studie Analisi Economica) Index of consumer confidence rose from 106.0 in April (1980=100) to 107.6 in May. Once again, it is clear from the second chart that the overall mood of the Italian consumer is subdued.
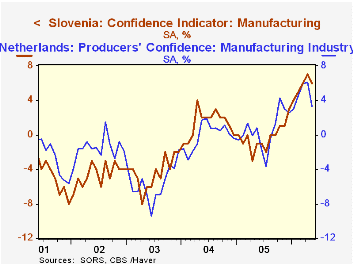
Both the Netherlands and Slovenia have also reported measures of business confidence. In both countries, those looking for improvement in the outlook have been greater than those looking for a deterioration since the last half of 2005. The percent balance, however, weakened in May. In the Netherlands the excess of optimists over pessimists fell from 6.1% in April to 3.3% in May. In Slovenia, the comparable figures were 7% and 6%. Business confidence measures in the two countries are shown in the third chart. In France, the INSEE (Institut de la Statistique et des Etudes Economiques) Monthly Business Survey also showed some weakness in business confidence. The percent balance of those responding to questions on the general outlook in manufacturing declined from 2% in April to 1% in May.
| Japan: | Mar 06 | Feb 06 | Mar 05 | M/M DIF | Y/Y DIF | 2005 | 2004 | 2003 |
|---|---|---|---|---|---|---|---|---|
| The Netherlands (% Bal) | ||||||||
| Consumer Confidence | -4 | -6 | -22 | 2 | 18 | -22 | -25 | -35 |
| Business Confidence | 3.3 | 6.1 | 0.8 | -2.8 | 2.5 | 0.6 | -0.1 | -5.6 |
| Slovenia (% Bal) | ||||||||
| Consumer Confidence | -15 | 19 | 14 | 4 | -1 | -20 | -19 | -20 |
| Business Confidence | 6 | 7 | -1 | -1 | 7 | -0 | 1 | -4 |
| Italy (1980=100) | ||||||||
| Consumer Confidence | 106.7 | 106.0 | 104.2 | 1.51* | 3.26* | 104.2 | 101.4 | 106.1 |
| France (% Bal) | ||||||||
| Business Outlook | 1 | 2 | -23 | -1 | 24 | -12 | 5 | -29 |

Tom Moeller
AuthorMore in Author Profile »Prior to joining Haver Analytics in 2000, Mr. Moeller worked as the Economist at Chancellor Capital Management from 1985 to 1999. There, he developed comprehensive economic forecasts and interpreted economic data for equity and fixed income portfolio managers. Also at Chancellor, Mr. Moeller worked as an equity analyst and was responsible for researching and rating companies in the economically sensitive automobile and housing industries for investment in Chancellor’s equity portfolio. Prior to joining Chancellor, Mr. Moeller was an Economist at Citibank from 1979 to 1984. He also analyzed pricing behavior in the metals industry for the Council on Wage and Price Stability in Washington, D.C. In 1999, Mr. Moeller received the award for most accurate forecast from the Forecasters' Club of New York. From 1990 to 1992 he was President of the New York Association for Business Economists. Mr. Moeller earned an M.B.A. in Finance from Fordham University, where he graduated in 1987. He holds a Bachelor of Arts in Economics from George Washington University.
More Economy in Brief


