 Global| Nov 19 2004
Chain-Linking Comes to Japan's GDP Accounts
Summary
The Cabinet Office of the Japanese Government announced yesterday that it would shift GDP calculations to chain-weighting beginning with the release of revised Q3 data on December 8. It will also switch the reference year from 1995 to [...]
The Cabinet Office of the Japanese Government announced yesterday that it would shift GDP calculations to chain-weighting beginning with the release of revised Q3 data on December 8. It will also switch the reference year from 1995 to 2000 and incorporate new input data in various components.
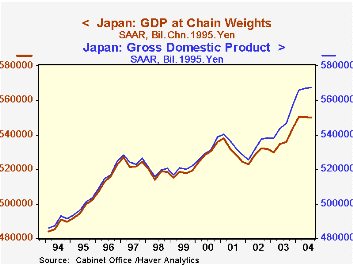
Beneficially for users, the Cabinet Office released "Interim series", in which the current official data are converted to a chain-weighted basis, so the effect of the chain-weighting alone can be seen. Total GDP in 1995 yen is reduced from ¥567.6 trillion in Q3 to ¥550.2 trillion, or about 3.1%. The hesitant growth in the latest couple of quarters is eliminated all together.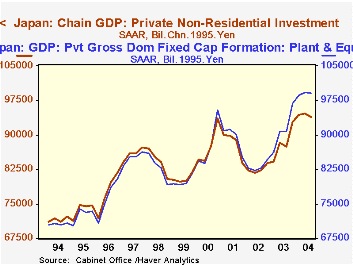
While this now flat pattern in Japanese GDP might be disappointing, some growth is still evident over the last year, and the pattern now in evidence allows a more realistic appraisal. Chain-weighting or chain-linking reduces the numerical impact on total growth of components for which prices are falling rapidly. Since computer prices are the main single source of price decline, the adjustment to growth is most apparent in fixed investment. Private fixed investment is lowered by ¥5.2 trillion or 5.3% in the latest quarter. While in nominal yen, investment is 15.5% of total GDP, its share of the chaining adjustment is 30%. Interestingly, this negative difference is, however, a recent development, and in the late 1990s, chained investment was sometimes slightly larger than fixed-weight investment. This unusual situation bears closer investigation and may be related to the overall pattern of deflation in the Japanese economy.
The "interim" chain-weight series are now contained in Haver's JAPAN database, right in the "National Accounts" menus. Our colleagues at Nomura Research Institute in Tokyo assisted with a quick translation of the release tables into English.
| Trillion Yen | 3 Qtr 2004 | 2 Qtr 2004 | Year Ago | 2003 | 2002 | 2001 |
|---|---|---|---|---|---|---|
| GDP: Chain Weighted | 550.2 | 550.4 | 535.8 | 535.9 | 528.9 | 530.8 |
| % Change | -0.0 | 0.0 | 2.7 | 1.3 | -0.4 | 0.2 |
| Fixed Weighted | 567.6 | 567.2 | 546.9 | 546.4 | 533.3 | 534.5 |
| % Change | 0.1 | 0.3 | 3.8 | 2.5 | -0.2 | 0.6 |
| Private Fixed Investment: Chain Weighted | 93.9 | 94.6 | 87.4 | 88.2 | 82.6 | 88.1 |
| % Change | -0.8 | 0.2 | 7.4 | 6.8 | -6.3 | 0.7 |
| Fixed Weighted | 99.1 | 99.3 | 90.7 | 91.1 | 83.1 | 89.3 |
| % Change | -0.2 | 0.6 | 9.2 | 9.6 | -6.9 | 1.7 |
Carol Stone, CBE
AuthorMore in Author Profile »Carol Stone, CBE came to Haver Analytics in 2003 following more than 35 years as a financial market economist at major Wall Street financial institutions, most especially Merrill Lynch and Nomura Securities. She had broad experience in analysis and forecasting of flow-of-funds accounts, the federal budget and Federal Reserve operations. At Nomura Securities, among other duties, she developed various indicator forecasting tools and edited a daily global publication produced in London and New York for readers in Tokyo. At Haver Analytics, Carol was a member of the Research Department, aiding database managers with research and documentation efforts, as well as posting commentary on select economic reports. In addition, she conducted Ways-of-the-World, a blog on economic issues for an Episcopal-Church-affiliated website, The Geranium Farm. During her career, Carol served as an officer of the Money Marketeers and the Downtown Economists Club. She had a PhD from NYU's Stern School of Business. She lived in Brooklyn, New York, and had a weekend home on Long Island.
More Economy in Brief


