 Global| Sep 29 2009
Case-Shiller Home Price IndexPosts Largest Monthly Increase Since 2005
by:Tom Moeller
|in:Economy in Brief
Summary
Firmer readings on home sales have given a lift to home prices. During July the S&P/Case-Shiller Home Price Composite Index of twenty metro-markets rose 1.2% from June and that was the firmest gain since late-2005. The monthly [...]
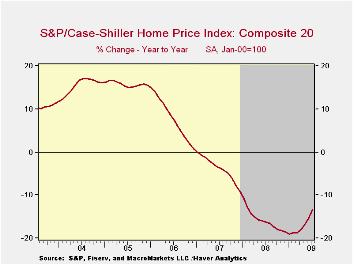 Firmer
readings on home sales have given a lift to home prices. During July
the S&P/Case-Shiller Home Price Composite
Index of twenty metro-markets rose 1.2% from June and that was the
firmest gain since late-2005. The monthly increase eased the y/y drop
to 13.3%, less than expected. Still, prices were down by
nearly one-third since the peak in May 2006. The July gain left prices
down less y/y than the expected 14.2%. Not seasonally adjusted prices
were even stronger m/m and posted a 1.6% increase after a 1.4% June
gain.
Firmer
readings on home sales have given a lift to home prices. During July
the S&P/Case-Shiller Home Price Composite
Index of twenty metro-markets rose 1.2% from June and that was the
firmest gain since late-2005. The monthly increase eased the y/y drop
to 13.3%, less than expected. Still, prices were down by
nearly one-third since the peak in May 2006. The July gain left prices
down less y/y than the expected 14.2%. Not seasonally adjusted prices
were even stronger m/m and posted a 1.6% increase after a 1.4% June
gain.
The Case-Shiller index of 20 U.S. cities and their
surrounding
areas is value-weighted. A greater index weight is assigned to more
expensive homes and the series dates back only to 2001. The
S&P/Case-Shiller home price series can be found in Haver's USECON
database and the city data highlighted below is in the REGIONAL
database.  Here is a
link to the latest press release. An overview of the
S&P/Case-Shiller home price series can be found here.·
The Case-Shiller composite index of home prices in 10 metropolitan
areas, which has a longer history and dates back to 1987, also firmed
last month by 1.3% (-12.8% y/y). This measure also was down by nearly
one-third since the 2006 peak.
Here is a
link to the latest press release. An overview of the
S&P/Case-Shiller home price series can be found here.·
The Case-Shiller composite index of home prices in 10 metropolitan
areas, which has a longer history and dates back to 1987, also firmed
last month by 1.3% (-12.8% y/y). This measure also was down by nearly
one-third since the 2006 peak.
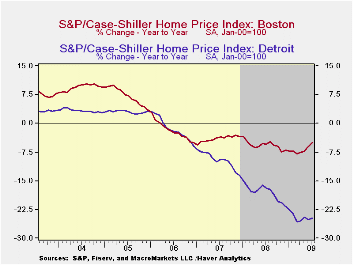
Less Weak Regions: Home prices in some areas of the country have firmed lately though they remain down year-to-year. In Cleveland, Ohio (-1.4% y/y) and in Dallas (-1.6% y/y) prices rose for the fourth consecutive month. Prices in Denver rose for their fifth month (-3.0% y/y). Boston prices also were higher during the July (-5.0% y/y) while in Chicago home prices were quite strong m/m and rose 2.1% (-14.2% y/y). In New York prices ticked up 0.9% m/m (-10.4% y/y) while in Charlotte, North Carolina prices were roughly unchanged (-9.0% y/y.)
 Weakest
Regions: Though
home prices in Phoenix, Arizona rose 1.2% m/m they remained off 28.5%
y/y. Home prices in Las Vegas, Nevada continued their rapid rate of
decline with a 1.9% m/m drop (-31.4% y/y) and also were down by roughly
one-half from their peak. Home prices in Miami edged up (-21.2% y/y
while home prices in Los Angeles also firmed (-14.9% y/y). In Tampa,
ticked higher for the second month but remained off 18.5% y/y. In
Detroit, the monthly rate of price decline also eased considerably
(-24.7% y/y) but prices were off by early one-half from the
peak. In San Francisco prices firmed for the second straight
month and that eased the y/y decline to 17.9%.
Weakest
Regions: Though
home prices in Phoenix, Arizona rose 1.2% m/m they remained off 28.5%
y/y. Home prices in Las Vegas, Nevada continued their rapid rate of
decline with a 1.9% m/m drop (-31.4% y/y) and also were down by roughly
one-half from their peak. Home prices in Miami edged up (-21.2% y/y
while home prices in Los Angeles also firmed (-14.9% y/y). In Tampa,
ticked higher for the second month but remained off 18.5% y/y. In
Detroit, the monthly rate of price decline also eased considerably
(-24.7% y/y) but prices were off by early one-half from the
peak. In San Francisco prices firmed for the second straight
month and that eased the y/y decline to 17.9%.
The Credit Crisis and Cycle-Proof Regulation from the Federal Reserve Bank of St. Louis can be found here.
| S&P/Case-Shiller Home Price Index (SA, Jan 00 = 100) | July | June | Y/Y | 2008 | 2007 | 2006 |
|---|---|---|---|---|---|---|
| 20 City Composite Index | 143.05 | 141.42 | -13.3% | -15.8% | -3.8% | 7.6% |
Weekly Gasoline Prices Fall To Lowest Level In One Month
by Tom Moeller September 29, 2009
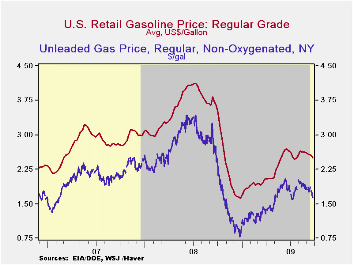 The pump
price for regular gasoline fell last week to the lowest
level since late-July. At an average $2.50 per gallon the price dropped
a nickel from the prior week and may have broken out of the sideways
pattern since early-June. These prices compare to the December low of
$1.61. Yesterday, prices fell further. The wholesale gasoline price was
down to $1.65 per gallon. Prices had reached a high in early-August of
$2.03. The figures are reported by the U.S. Department of Energy and
can be found in Haver's WEEKLY & DAILY databases.
The pump
price for regular gasoline fell last week to the lowest
level since late-July. At an average $2.50 per gallon the price dropped
a nickel from the prior week and may have broken out of the sideways
pattern since early-June. These prices compare to the December low of
$1.61. Yesterday, prices fell further. The wholesale gasoline price was
down to $1.65 per gallon. Prices had reached a high in early-August of
$2.03. The figures are reported by the U.S. Department of Energy and
can be found in Haver's WEEKLY & DAILY databases.
During August, the consumer price index for gasoline recouped the July decline with a not seasonally adjusted 3.3% increase. Seasonally adjusted gas prices were quite firm and rose 9.1% m/m, up 40.3% YTD.
Crude
oil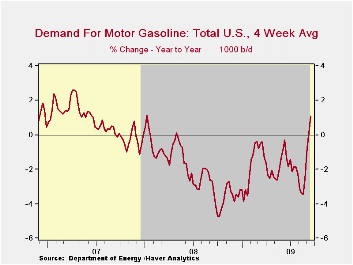 prices have led the decline in refined product prices.
Light sweet crude oil prices (WTI) fell to $68.41 per barrel, though
that still was up from the December low of $32.37. Yesterday, the spot
market price for light sweet crude oil fell further to $66.84 per
barrel versus a daily high of $71.55 last week.
prices have led the decline in refined product prices.
Light sweet crude oil prices (WTI) fell to $68.41 per barrel, though
that still was up from the December low of $32.37. Yesterday, the spot
market price for light sweet crude oil fell further to $66.84 per
barrel versus a daily high of $71.55 last week.
The demand for gasoline continued to improve through mid-month. The y/y rise of 1.1% was the first meaningful positive comparison since early-2007. Demand for residual fuel oil slacked off from its earlier strength and fell 5.1% y/y while distillate demand is off 13.2% y/y. Finally, oil remains plentiful as evidenced by a 16.5% y/y rise in inventories of crude oil & petroleum products. Inventories of gasoline recently have surged and are up 19.2% versus last year. The figures on crude oil production and inventories are available in Haver's OILWKLY database.
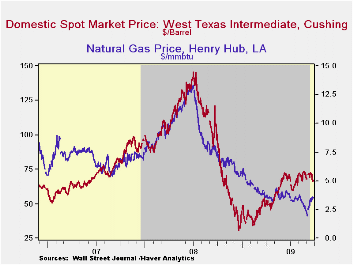
Natural gas prices increased again last week to an average of $3.48 per mmbtu (-54.9% y/y) but they remained down by three-quarters from the high reached in early-July of last year of $13.19/mmbtu. Yesterday prices were up from last week's level at $3.54/mmbtu.
| Weekly Prices | 09/28/09 | 09/21/09 | Y/Y | 2008 | 2007 | 2006 |
|---|---|---|---|---|---|---|
| Retail Regular Gasoline ($ per Gallon, Regular) | 2.50 | 2.55 | -31.2% | 3.25 | 2.80 | 2.57 |
| Light Sweet Crude Oil, WTI ($ per bbl.) | 68.41 | 71.36 | -37.9% | 100.16 | 72.25 | 66.12 |
U.S. Consumer Confidence Moves Sideways After Spring Bounce
by Tom Moeller September 29, 2009
The Conference Board indicated that consumer confidence during September dipped from August. Though both figures were up sharply from the February low, the trend in the series has been roughly sideways since May. The Conference Board data can be found in Haver's CBDB database.
During the last ten years there has been an 86% correlation between the level of consumer confidence and the y/y change in real consumer spending.
Consumers' assessment of the current economic conditions fell
again this month and remained near the historic low. It remained off by
almost two-thirds from one year earlier. Jobs were seen as hard to get
by an increased 47.0% of respondents and jobs were seen as plentiful by
3.4% which was near the series' historic low. Business conditions were
seen as good by just 8.7% and that also was near the series' low.
Consumers who thought business conditions were bad rose slightly to
46.3%. While off somewhat from its high the reading still near the
highest since 1983.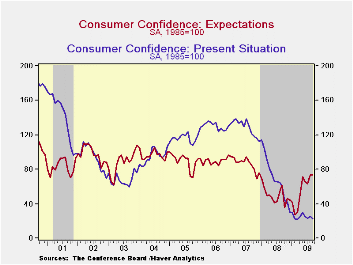
The expectations component of confidence slipped from August but the index remained near the highest level since late-2007. The percentage of respondents expecting business conditions to improve slipped to 21.3% though that remained near the highest level since 2004. A much reduced 15.0% expected conditions to worsen. That was off from the recent February high of 40.7%. An improved 17.9% of respondents expected economic improvement to generate more jobs, more than double the percentage at the recent low.
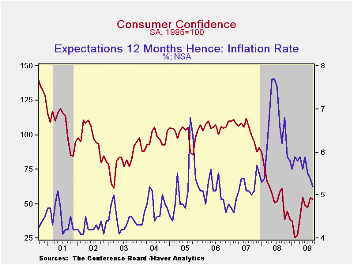
Expectations for the inflation rate in twelve months fell back to 5.2%, the lowest level since 2007 and down from last year's high of 7.7%. Interest rates in twelve months were expected to be higher by 48.8% of respondents, while 14.8% expected rates to fall. A greatly increased 35.4% of respondents expected stock prices to rise.
Consumers continued to manage their spending plans cautiously. Just 2.3% plan to buy a home during the next six months while 23.8% plan to buy a major appliance. That's versus 30.9% back in 2007. Only 4.4% plan to buy an automobile versus 6.0% in 2007. Just 2.1% plan to buy a new one.
Is The Financial Crisis Over? A Yield Spread Perspective from the Federal Reserve Bank of St. Louis is available here.
| Conference Board (SA, 1985=100) | September | August | Y/Y % | 2008 | 2007 | 2006 |
|---|---|---|---|---|---|---|
| Consumer Confidence Index | 53.1 | 54.5 | -13.5 | 57.9 | 103.4 | 105.9 |
| Present Situation | 22.7 | 25.4 | -62.8 | 69.9 | 128.8 | 130.2 |
| Expectations | 73.3 | 73.8 | 19.2 | 50.0 | 86.4 | 89.7 |
Confidence Improving in the Euro Area: Recession Ending?
by Louise Curley September 29, 2009
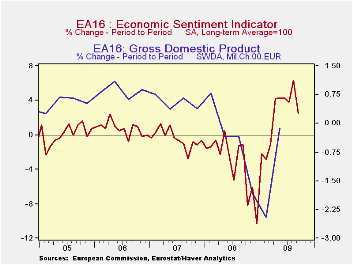 Eurostat
reported today that its economic sentiment indicator
(ESI) for September rose to 82.8 from 80.8 in August. The measure has
now risen in the last five months from the low of 64.6 reached in
March. Although it is still below its long term average of 100, the
improvement that has taken place in the indicator suggests that
economic activity in third quarter is likely to be positive for the
Euro area as a whole. The attached chart of the month to month changes
in the ESI and the quarter to quarter changes in GDP shows that the
change in the ESI is a good predictor of subsequent changes in GDP.
Eurostat
reported today that its economic sentiment indicator
(ESI) for September rose to 82.8 from 80.8 in August. The measure has
now risen in the last five months from the low of 64.6 reached in
March. Although it is still below its long term average of 100, the
improvement that has taken place in the indicator suggests that
economic activity in third quarter is likely to be positive for the
Euro area as a whole. The attached chart of the month to month changes
in the ESI and the quarter to quarter changes in GDP shows that the
change in the ESI is a good predictor of subsequent changes in GDP.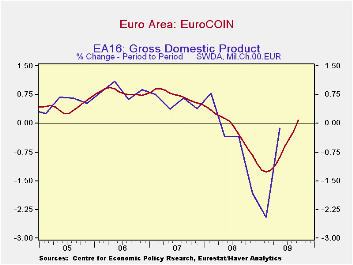
Another indicator of rising sentiment in the Euro Area is the "EuroCOIN" indicator that was released a few days ago. This is a monthly indicator of GDP that, according to its authors, the Bank of Italy in collaboration with the Centre for Economic Policy Research, is "a real-time estimate of underlying trend of GDP. i.e. growth adjusted for short term fluctuations." The EuroCOIN indicator has been rising since January of this year and was slightly positive at 0.07 in September, the first time it was positive since June 2008. The second chart compares the EuroCOIN indicator with the changes in real GDP and like the ESI suggests an ending of the recession in the third quarter for the Euro Area as a whole.
| Sep 09 | Aug 09 | Jul 09 | Jun 09 | May 09 | Apr 09 | Mar 09 | Feb 09 | Jan 09 | |
|---|---|---|---|---|---|---|---|---|---|
| Eurostat Economic Sentiment Indicator (CSI) | 82.8 | 80.8 | 76.0 | 73.2 | 70.2 | 9.73 | 64.6 | 65.3 | 67.2 |
| EuroCOIN | 0.07 | -0.21 | -0.42 | -0.61 | -0.88 | -1.09 | -1.22 | -1.27 | -1.21 |

Tom Moeller
AuthorMore in Author Profile »Prior to joining Haver Analytics in 2000, Mr. Moeller worked as the Economist at Chancellor Capital Management from 1985 to 1999. There, he developed comprehensive economic forecasts and interpreted economic data for equity and fixed income portfolio managers. Also at Chancellor, Mr. Moeller worked as an equity analyst and was responsible for researching and rating companies in the economically sensitive automobile and housing industries for investment in Chancellor’s equity portfolio. Prior to joining Chancellor, Mr. Moeller was an Economist at Citibank from 1979 to 1984. He also analyzed pricing behavior in the metals industry for the Council on Wage and Price Stability in Washington, D.C. In 1999, Mr. Moeller received the award for most accurate forecast from the Forecasters' Club of New York. From 1990 to 1992 he was President of the New York Association for Business Economists. Mr. Moeller earned an M.B.A. in Finance from Fordham University, where he graduated in 1987. He holds a Bachelor of Arts in Economics from George Washington University.
More Economy in Brief


