 Global| Jul 28 2009
Case-Shiller Home Price IndexDecline Eases
by:Tom Moeller
|in:Economy in Brief
Summary
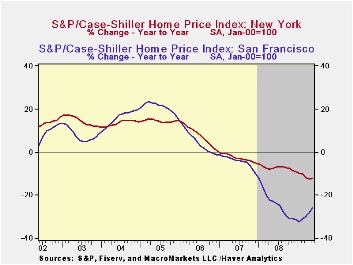
The declines in home prices are moderating. That's the message from May's 0.2% seasonally adjusted decline in the S&P/Case-Shiller Home Price Composite Index of twenty metro-markets. The moderation eased the y/y drop to 17.1% but [...]
 The
declines
in home prices are moderating. That's the message from May's 0.2%
seasonally adjusted decline in the S&P/Case-Shiller
Home Price Composite Index of twenty metro-markets. The moderation
eased the y/y drop to 17.1% but prices still were
down by nearly one-third since the peak in May 2006. The May decline in
prices was less than the expected 17.9% y/y drop, and not seasonally
adjusted, prices even posted an increase of 0.5% for the month.
The
declines
in home prices are moderating. That's the message from May's 0.2%
seasonally adjusted decline in the S&P/Case-Shiller
Home Price Composite Index of twenty metro-markets. The moderation
eased the y/y drop to 17.1% but prices still were
down by nearly one-third since the peak in May 2006. The May decline in
prices was less than the expected 17.9% y/y drop, and not seasonally
adjusted, prices even posted an increase of 0.5% for the month.
The Case-Shiller index of 20 U.S. cities and their surrounding areas is value-weighted. A greater index weight is assigned to more expensive homes and the series dates back only to 2001. The S&P/Case-Shiller home price series can be found in Haver's USECON database and the city data highlighted below is in the REGIONAL database. Here is a link to the latest press release from Standard & Poor's. An overview of the S&P/Case-Shiller home price series can be found here.
pThe Case-Shiller composite index of home prices in 10 metropolitan areas, which has a longer history and dates back to 1987, also fell a lessened 0.2% last month and was down 16.8% year-to-year. This measure also was down by nearly one-third since the 2006 peak.
 Less
Weak Regions: Home prices in some areas
of the country have firmed lately though they remain down year-to-year.
In Cleveland, Ohio prices rose for the second month
(-6.2% y/y) and in Dallas prices rose slightly m/m as well (-4.2% y/y).
Prices ticked up 0.3% in Denver (-4.6% y/y). Boston prices
also ticked higher during the month (-7.2% y/y) and in Chicago home
prices rose slightly (-17.5% y/y). In New York prices slipped m/m
(-12.2% y/y) and are off roughly 20% from their 2006 peak. In
Charlotte, North Carolina prices also continued down but just
moderately (-10.1% y/y.).
Less
Weak Regions: Home prices in some areas
of the country have firmed lately though they remain down year-to-year.
In Cleveland, Ohio prices rose for the second month
(-6.2% y/y) and in Dallas prices rose slightly m/m as well (-4.2% y/y).
Prices ticked up 0.3% in Denver (-4.6% y/y). Boston prices
also ticked higher during the month (-7.2% y/y) and in Chicago home
prices rose slightly (-17.5% y/y). In New York prices slipped m/m
(-12.2% y/y) and are off roughly 20% from their 2006 peak. In
Charlotte, North Carolina prices also continued down but just
moderately (-10.1% y/y.).
Weakest Regions: Home prices in Phoenix, Nevada were quite weak and fell another 1.7% m/m (-34.2% y/y. Home prices in Las Vegas, Nevada continued their rapid rate of decline with a 3.1% m/m drop (-32.0% y/y, and also were down by roughly one-half from their peak. Home prices in Miami again fell a hard 1.1% (-25.1% y/y while home prices in Los Angeles continued to fall sharply (-19.8% y/y). In Tampa, the rate of monthly price decline slowed slightly to just 0.5% but prices still were off 20.8% y/y. In Detroit, the monthly rate of price decline also eased considerably (-24.5% y/y) but prices were off by early one-half from the peak. In San Francisco prices rose 0.7%, but remained off 26.1% y/y.
 Released
last week was the
House Price Index (HPH) from the
Federal Housing and Finance Agency (FHFA). The index rose 0.9% from
April for just the third monthly increase since 2005. Year-to-year,
that was enough to lessen the decline in the nationwide average of home
prices to 5.6% from its worst reading of -8.9% last November. The FHFA
uses data provided by Fannie Mae and Freddie Mac. The series differs
from Case-Shiller in that it is not value-weighted, it covers a greater
area and it has a shorter history.
Released
last week was the
House Price Index (HPH) from the
Federal Housing and Finance Agency (FHFA). The index rose 0.9% from
April for just the third monthly increase since 2005. Year-to-year,
that was enough to lessen the decline in the nationwide average of home
prices to 5.6% from its worst reading of -8.9% last November. The FHFA
uses data provided by Fannie Mae and Freddie Mac. The series differs
from Case-Shiller in that it is not value-weighted, it covers a greater
area and it has a shorter history.
| S&P/Case-Shiller Home Price Index (SA, Jan 00 = 100) | May | April | Y/Y | 2008 | 2007 | 2006 |
|---|---|---|---|---|---|---|
| 20 City Composite Index | 140.05 | 140.28 | -17.1% | -15.8% | -3.8% | 7.6% |
by Tom Moeller July 28, 2009
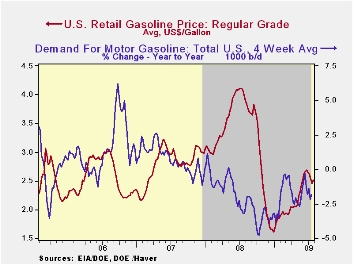
Signs that the worst of the downtrend in the U.S. economy may have passed helped stabilize the earlier weakness in the oil market. The pump price for regular gasoline increased last week to an average $2.50 per gallon, though that still was down nineteen cents from last month's high. The increase added to the eighty cent (55%) rise from the December low. At $1.87 per gallon in the cash market, gasoline prices yesterday continued to rally off the early-July low of $1.60. The figures are reported by the U.S. Department of Energy and can be found in Haver's WEEKLY & DAILY databases.
Crude oil prices also recovered last week. Light sweet crude oil prices (WTI) increased to $64.99 per barrel, up $3.72 from the low. Yesterday the spot market price for light sweet crude oil recovered further to $68.38 per barrel. Prices had reached a daily high of $72.68 earlier in July.
Natural gas prices rose slightly for the second week. Last week's average price of $3.49 per mmbtu (-64.8% y/y) was down by three-quarters from the high reached in early-July of last year of $13.19/mmbtu.
Financial Stress: What Is It, How Can It Be Measured, and Why Does It Matter? from the Federal Reserve Bank of Kansas City can be found here.
| Weekly Prices | 07/27/09 | 07/20/09 | Y/Y | 2008 | 2007 | 2006 |
|---|---|---|---|---|---|---|
| Retail Regular Gasoline ($ per Gallon, Regular) | 2.50 | 2.46 | -36.7% | 3.25 | 2.80 | 2.57 |
| Light Sweet Crude Oil, WTI ($ per bbl.) | 64.99 | 61.27 | -48.5% | 100.16 | 72.25 | 66.12 |
by Robert Brusca July 28, 2009
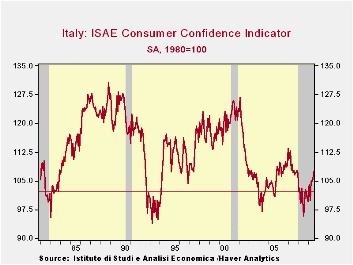
Confidence is UP! Consumer confidence in
Italy is at its highest since November 2007. Still since January 1992
the reading stand is at the 40th to 41st percentile of its range and in
terms of the ranking among all previous observations. This it is some
10 percentage points below its middle position in terms of range or
ranking percentiles. Ranking percentiles position a reading in a queue
of values while range percentiles position the reading in a range
bounded by the high and low readings. Both readings have some merit.
Past 12 month - Rating the past twelve
months, the overall situation is rates as a -68 which puts it in the
55th percentile in terms of rankings. Prices trends at -48 are the
worst in this period by either range of ranking methods.
The expected future - Looking ahead the
next twelve months overall situation is assigned a value of +2 leaving
it in the top 92nd percentile by ranking, but only the 65th percentile
according to the position of the reading in its range. Obviously among
all rankings this reading is relatively strong but there must be a
strong reading that lies at a much, much higher level to depress the
range reading so much. That would be a reading from June 2001, as from
April to Sept of 2001 readings on this score soared then dipped back to
a more normal range. Unemployment readings are still elevated at a +8
reading. That leaves the reading in the moderated 55th percentile by
range but at a much higher 94th percentile by ranking. Those two
readings tell us that the unemployment reading is rarely higher than
this but it has spiked much higher in the past. The response to the
household budget situation remains weak by any measure at a +1.
Current/Future comparisons - Households
assess their current and future situations as about to be much improved
in the next twelve months with their range and ranking percentile
readings rising from a bottom quarter or third position currently to a
50% to two-thirds position in the outlook. Current savings are
considered high, future savings are expected to be low. Similarly,
major purchase environment was construed as middling over the past
12-months abut is expected to improve sharply to top 4% or better in
the future.
Summing up - On balance these responses by
Italian households show a clear disappointment with past trends. In
that respect the expected future improvement is harder to read. Some of
the future readings are more middling some are strong. It is still not
clear if consumers simply are optimistic that things will improve from
the dregs of the last 12 months or if things are expected to improved
to true strong readings. As current conditions improve we will monitor
these future readings and see if they continue to show the strength
that some of the categories currently exhibit. If much better
conditions are expected then as the current readings improve the future
readings should remain high. If the future is simply expected to be
‘normal’ as the current situation normalizes the expectations readings
in the survey will recede to a region of boredom.
| Jul-09 | Jun-09 | May-09 | Apr-09 | Percentile | Rank | percentile | |
|---|---|---|---|---|---|---|---|
| Consumer Confidence | 107.5 | 105.4 | 104.9 | 104.9 | 41.3 | 126 | 40.3% |
| Last 12 months | |||||||
| OVERALL SITUATION | -68 | -68 | -73 | -74 | 63.2 | 93 | 55.9% |
| PRICE TRENDS | -48 | -40.5 | -45 | -43 | 0.0 | 211 | 0.0% |
| Next 12months | |||||||
| OVERALL SITUATION | 2 | -8 | -17 | -26 | 65.1 | 16 | 92.4% |
| PRICE TRENDS | 1.5 | 8.5 | 10 | 9.5 | 3.1 | 112 | 46.9% |
| UNEMPLOYMENT | 8 | 15 | 17 | 21 | 55.9 | 11 | 94.8% |
| HOUSEHOLD BUDGET | 1 | 0 | 5 | 1 | 17.0 | 199 | 5.7% |
| HOUSEHOLD FIN SITUATION | |||||||
| Last 12 months | -40 | -37 | -34 | -37 | 32.7 | 155 | 26.5% |
| Next12 months | -2 | -4 | -5 | -11 | 67.3 | 91 | 56.9% |
| HOUSEHOLD SAVINGS | |||||||
| Current | 60 | 60 | 59 | 60 | 72.7 | 13 | 93.8% |
| Future | -30 | -25 | -29 | -29 | 38.3 | 170 | 19.4% |
| MAJOR Purchases | |||||||
| Current | -40 | -39 | -43 | -41 | 42.1 | 99 | 53.1% |
| Future | 4 | 3 | 1 | 3 | 96.8 | 3 | 98.6% |

Tom Moeller
AuthorMore in Author Profile »Prior to joining Haver Analytics in 2000, Mr. Moeller worked as the Economist at Chancellor Capital Management from 1985 to 1999. There, he developed comprehensive economic forecasts and interpreted economic data for equity and fixed income portfolio managers. Also at Chancellor, Mr. Moeller worked as an equity analyst and was responsible for researching and rating companies in the economically sensitive automobile and housing industries for investment in Chancellor’s equity portfolio. Prior to joining Chancellor, Mr. Moeller was an Economist at Citibank from 1979 to 1984. He also analyzed pricing behavior in the metals industry for the Council on Wage and Price Stability in Washington, D.C. In 1999, Mr. Moeller received the award for most accurate forecast from the Forecasters' Club of New York. From 1990 to 1992 he was President of the New York Association for Business Economists. Mr. Moeller earned an M.B.A. in Finance from Fordham University, where he graduated in 1987. He holds a Bachelor of Arts in Economics from George Washington University.