 Global| Jan 12 2005
Canada's Trade Surplus Widens in November
Summary
Canada's trade situation improved in November, as a small decrease in exports was well overweighted with a 10.1% drop in imports. The consequent balance of merchandise trade was a surplus Can$7.3 billion, the third largest on record. [...]
Canada's trade situation improved in November, as a small decrease in exports was well overweighted with a 10.1% drop in imports. The consequent balance of merchandise trade was a surplus Can$7.3 billion, the third largest on record. In US$, the surplus pierced US$6 billion, the largest ever.
Exports fell 2.9%, with moderate reductions in several types of products. By geography, the largest absolute drop occurred in shipments to the US, but percentage-wise, shipments to Europe were off by more than 10% on the month.
The drop in imports featured sizable declines – 10% or more – in a variety of product-types. Among regions, the US and Europe both had double-digit declines in sales to Canada.
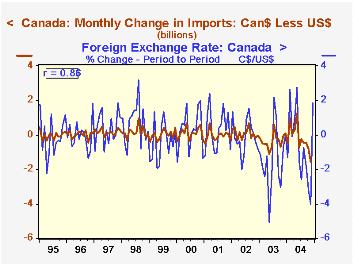
Part of the drop in imports is a continuing correction to sizable increases that pushed the Canadian-dollar value of imports to a record Can$31.8 billion in both May and July. But Canadian statistics officials pointed out today that the November performance accompanied a marked increase in the exchange rate; this was 4.2% in November alone in US$/Can$ terms, extending a rise that totaled 15% since May. As clearly evident in the graph, the value of Canada's imports has a remarkable relationship with the exchange rate. Percent changes in the rate (shown here in the reciprocal Can$/US$) have a substantial 86% correlation with the monthly change in the difference of imports measured in Can$ less imports measured in US$. Trade with the US of course dominates Canadian trade (imports from the US are about two-thirds of Canada's total) and this tight currency value relationship highlights how strong that bond is, even on a month-to-month basis.
| Billions of Canadian$, Seasonally Adjusted |
Nov 2004 | Oct 2004 |
Year Ago | Monthly Average|||
|---|---|---|---|---|---|---|
| 2003 | 2002 | 2001 | ||||
| Exports | 34.7 | 35.7 | +8.6% | 33.3 | 34.5 | 35.1 |
| Imports | 27.4 | 30.5 | -1.5% | 28.5 | 29.7 | 29.2 |
| Balance | +7.3 | +5.2 | +4.1 | +4.8 | +4.8 | +5.8 |
| Balance, US$ | +6.1 | +4.2 | +3.1 | +3.5 | +3.0 | +3.8 |
| Exchange Rate, US$/CAN$ | 0.8356 | 0.8020 | +9.7% | 0.7157 | 0.6368 | 0.6457 |
Carol Stone, CBE
AuthorMore in Author Profile »Carol Stone, CBE came to Haver Analytics in 2003 following more than 35 years as a financial market economist at major Wall Street financial institutions, most especially Merrill Lynch and Nomura Securities. She had broad experience in analysis and forecasting of flow-of-funds accounts, the federal budget and Federal Reserve operations. At Nomura Securities, among other duties, she developed various indicator forecasting tools and edited a daily global publication produced in London and New York for readers in Tokyo. At Haver Analytics, Carol was a member of the Research Department, aiding database managers with research and documentation efforts, as well as posting commentary on select economic reports. In addition, she conducted Ways-of-the-World, a blog on economic issues for an Episcopal-Church-affiliated website, The Geranium Farm. During her career, Carol served as an officer of the Money Marketeers and the Downtown Economists Club. She had a PhD from NYU's Stern School of Business. She lived in Brooklyn, New York, and had a weekend home on Long Island.
More Economy in Brief


