 Global| Jan 26 2009
Canada's Mixed Inflation Picture...
Summary
While headline inflation continues to lose steam in Canada as it does everywhere else in the world, Canada’s core rate is not on that same page. Over three-months core inflation has escalated to a pace of +2.6% from under 2% over [...]
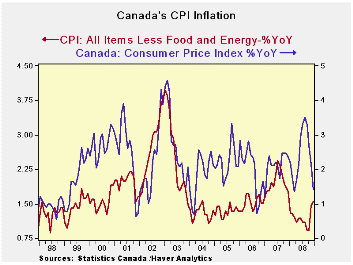
While headline inflation continues to lose steam in Canada as
it does everywhere else in the world, Canada’s core rate is not on that
same page. Over three-months core inflation has escalated to a pace of
+2.6% from under 2% over previous key horizons (see table). By
comparison, Canada’s CPIx, that excludes eight volatile categories
shows inflation remains steady at a pace of 2.2% to 2.4%. This is not a
question about inflation spiking but a question about what sort of
momentum inflation now has in Canada and what pressures the bank of
Canada faces in setting policy. .
The headline rate points clearly lower, with inflation down by
6.1% over three months (annualized) or up by just 1.2% Yr/Yr. Both of
those are good results. The dropping and negative three-month and
six-month results suggest that there may be more relief in inflation to
be passed on to core and nonvolatile items in the months ahead. But for
now Canada’s main inflation trends as depicted by the core or CPIx are
best viewed as moderate and steady.
| Canada's CPI and Core Inflation | |||||||
|---|---|---|---|---|---|---|---|
| % MO/MO | % saar | ||||||
| Dec-08 | Nov-08 | Oct-08 | 3-MO | 6-MO | 12-MO | Yr Ago | |
| All Items | -0.5% | -0.3% | -0.8% | -6.1% | -2.1% | 1.2% | 2.4% |
| All Items SA | -0.4% | -0.3% | -0.6% | -5.1% | -1.6% | 1.4% | 2.4% |
| CPI Core | 0.1% | 0.5% | 0.0% | 2.6% | 1.5% | 1.6% | 1.8% |
| All items Excl 8 Volatile (CPIx) | -0.1% | 0.6% | 0.0% | 2.2% | 2.2% | 2.4% | 1.5% |
| RPIxseas food | -0.3% | 0.6% | 0.2% | 2.2% | 3.9% | 4.1% | 4.3% |
| Food & Non Alcohol Bev | 0.3% | 1.0% | 0.6% | 7.7% | 8.7% | 7.2% | 1.7% |
| Shelter | 0.0% | 0.2% | 0.1% | 1.0% | 1.8% | 3.5% | 4.0% |
| Clothing & Footwear | -0.3% | 0.4% | -0.9% | -3.0% | -3.0% | -2.5% | 0.1% |
| Education | 0.2% | 0.2% | 0.7% | 4.6% | 3.8% | 3.1% | 3.1% |
| Health & Personal Care | 0.2% | 0.5% | 0.1% | 3.0% | 3.4% | 2.0% | 1.3% |
| Transportation | -0.6% | -0.7% | -0.8% | -8.1% | -3.8% | 0.1% | 2.6% |
| A RED highlight indicates inflation accelerating from pace of previous horizon | |||||||

Robert Brusca
AuthorMore in Author Profile »Robert A. Brusca is Chief Economist of Fact and Opinion Economics, a consulting firm he founded in Manhattan. He has been an economist on Wall Street for over 25 years. He has visited central banking and large institutional clients in over 30 countries in his career as an economist. Mr. Brusca was a Divisional Research Chief at the Federal Reserve Bank of NY (Chief of the International Financial markets Division), a Fed Watcher at Irving Trust and Chief Economist at Nikko Securities International. He is widely quoted and appears in various media. Mr. Brusca holds an MA and Ph.D. in economics from Michigan State University and a BA in Economics from the University of Michigan. His research pursues his strong interests in non aligned policy economics as well as international economics. FAO Economics’ research targets investors to assist them in making better investment decisions in stocks, bonds and in a variety of international assets. The company does not manage money and has no conflicts in giving economic advice.


