 Global| May 08 2009
Bad News: U.S. Jobless Rate Jumpsto 8.9% Good News: Speed of Job Losses Ease
by:Tom Moeller
|in:Economy in Brief
Summary
Some easing of the weakness in the U.S. labor market may be evident in the April figures from the Bureau of Labor Statistics, but the labor market remains soft. Nonfarm payrolls fell 539,000 last month. It was the smallest monthly [...]
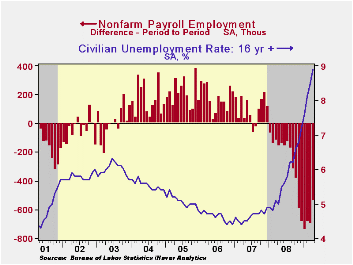 Some easing
of the weakness in the U.S. labor market may be evident in the April
figures from the Bureau of Labor Statistics, but the labor market
remains soft. Nonfarm payrolls fell 539,000 last
month. It was the smallest monthly decline since October and it
compares with Consensus expectations for a 610,000 decline. Declines in
employment during the prior two months, however, were revised deeper.
During this recession so far, employment has fallen a total of 5.7
million, the record for a 16-month period. Even after accounting for
the labor force's larger size, that's a huge number. In percentage
terms, jobs are down 4.2% since the 2007 peak.
Some easing
of the weakness in the U.S. labor market may be evident in the April
figures from the Bureau of Labor Statistics, but the labor market
remains soft. Nonfarm payrolls fell 539,000 last
month. It was the smallest monthly decline since October and it
compares with Consensus expectations for a 610,000 decline. Declines in
employment during the prior two months, however, were revised deeper.
During this recession so far, employment has fallen a total of 5.7
million, the record for a 16-month period. Even after accounting for
the labor force's larger size, that's a huge number. In percentage
terms, jobs are down 4.2% since the 2007 peak.
The unemployment rate very much reflects the softness in the labor market. The rise to an expected 8.9% brought it to the highest level since September of 1983 and that compares to the recent low of 4.4% in October of 2006. Last months' increase reflected a 683,000 jump (+0.5% y/y) in the labor force juxtaposed against a moderate rebound in household employment of 120,000 (-3.6% y/y). These household sector figures additionally show that long-term unemployment rose further. The average duration of unemployment rose during April to a new record 21.4 weeks, up from 16.9 weeks during 2007. The number of those unemployed for longer than 15 weeks more than doubled during the last year and they accounted for nearly half of all those who are unemployed.
 A glimmer of hope for the job market may be
evident. The payroll survey showed that 28.2% of industries were hiring
last month, the highest percentage since last October. The breadth of
job loss, nonetheless, remains large. In the construction industry
110,000 jobs were lost last month, bringing the total to 1.4 million
since early 2007. Factory jobs were down another 149,000
April, adding to the 10-year downtrend during which over 5 million jobs
have been shed, nearly one-third of the total,. In the private service
sector, the picture remained bleak as it shed 341,000 jobs last month
and nearly 3.0 million (3.0%) since the peak in late 2007. The
government sector picked up some of the job market slack last month as
more workers were hired to take the 2010 Census. Government sector
payrolls rose 72,000 (0.7% y/y) after having been flat since the middle
of last year.
A glimmer of hope for the job market may be
evident. The payroll survey showed that 28.2% of industries were hiring
last month, the highest percentage since last October. The breadth of
job loss, nonetheless, remains large. In the construction industry
110,000 jobs were lost last month, bringing the total to 1.4 million
since early 2007. Factory jobs were down another 149,000
April, adding to the 10-year downtrend during which over 5 million jobs
have been shed, nearly one-third of the total,. In the private service
sector, the picture remained bleak as it shed 341,000 jobs last month
and nearly 3.0 million (3.0%) since the peak in late 2007. The
government sector picked up some of the job market slack last month as
more workers were hired to take the 2010 Census. Government sector
payrolls rose 72,000 (0.7% y/y) after having been flat since the middle
of last year.
The length of the average workweek remained stable at a much-reduced level of 33.2 hours. That compares with a fairly stable level near 34 hours through late-2007 but it's been trending lower from the high over 38 hours in the mid-1960s.
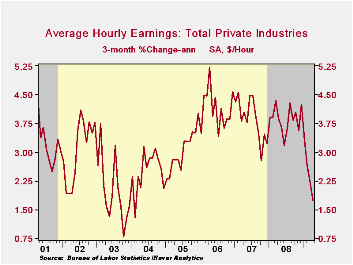
The weak labor market has taken a further toll on average hourly earnings in private industries. The 0.1% m/m gain last month was the weakest in five years and it pulled the three- month annualized growth rate to 1.7%, also the lowest since early-2004. The private service sector has felt the brunt of that weakness. The annual growth in earnings fell to just 3.2% last month, down from a five percent growth rate in early 2006. Surprisingly, annual growth in earnings in the factory sector has held up at 2.8% and construction sector earnings rose a stable 4.5%.
 The figures referenced above are available in
Haver's USECON
database. Additional detail can be found in the LABOR and
in the EMPL databases.
The figures referenced above are available in
Haver's USECON
database. Additional detail can be found in the LABOR and
in the EMPL databases.
Trends in consumer sentiment and spending from the Federal Reserve Bank of Chicago is available here.
Public and Private Sector Compensation: What is Affordable in This Recession and Beyond? - A Conference Summary, also from the Federal Reserve Bank of Chicago can be found here.
| Employment: 000s | April | March | February | Y/Y | 2008 | 2007 | 2006 |
|---|---|---|---|---|---|---|---|
| Payroll Employment | -539 | -699 | -681 | -3.8% | -0.4% | 1.1% | 1.8% |
| Previous | -- | -663 | -651 | -- | -- | -- | -- |
| Manufacturing | -149 | -167 | -172 | -10.6% | -3.3% | -2.0% | -0.5% |
| Construction | -110 | -135 | -113 | -13.5% | -5.5% | -0.8% | 4.9% |
| Service Producing | -269 | -381 | -386 | -2.4% | 0.2% | 1.6% | 1.8% |
| Average Weekly Hours | 33.2 | 33.2 | 33.3 | 33.8 (April '08) | 33.6 | 33.8 | 33.9 |
| Average Hourly Earnings | 0.1% | 0.2% | 0.2% | 3.2% | 3.8% | 4.0% | 3.9% |
| Unemployment Rate | 8.9% | 8.5% | 8.1% | 5.0% (April '08) | 5.8% | 4.6% | 4.6% |
by Robert Brusca May 8, 2009
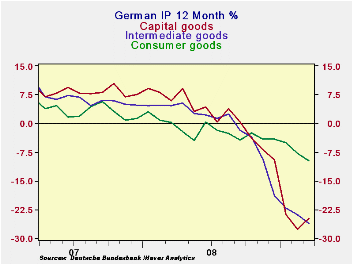
German industrial production halted its string of six
consecutive declines with a flat result in March. Over three months the
negative growth rate for IP has flattened but at a still horrific -33%
(saar). Ironically, the capital goods sector shows the worst results
and fasted decline in its three month rate of growth compared to other
sectors. Yet the capital goods sector is the only sector with an output
increase in March – and a strong one at that.
Construction is in its second month of increasing output.
However, manufacturing output fell in March, but it did trim that drop
to -0.2% from -3.5% previously. And of course the flat IP result fits
in nicely with the surge in German orders in March. The process of
blunting the forces of the downturn and establishing an environment of
growth is now fully engaged in Germany, Europe’s largest economy.
Coupled with the fresh ECB rate cut and the ECB’s decision on to engage
in covered bond purchases, Europe has some new reason for hope.
| Total German IP | |||||||
|---|---|---|---|---|---|---|---|
| Saar exept m/m | Mar-09 | Feb-09 | Jan-09 | 3-mo | 6-mo | 12-mo | Quarter-to-Date |
| IP total | 0.0% | -3.4% | -6.3% | -32.7% | -33.1% | -20.3% | -40.1% |
| Consumer | -2.0% | -3.7% | -0.6% | -22.7% | -14.6% | -9.8% | -13.9% |
| Capital | 2.5% | -5.2% | -13.5% | -50.1% | -41.5% | -24.7% | -55.8% |
| Intermed | -2.4% | -1.3% | -4.0% | -27.0% | -40.4% | -26.2% | -43.9% |
| Memo | |||||||
| Construction | 7.6% | 1.9% | -7.5% | 5.5% | 14.6% | 4.9% | -0.6% |
| MFG IP | -0.2% | -3.5% | -7.7% | -37.8% | -37.1% | -22.9% | -45.7% |
| MFG Orders | 3.3% | -3.1% | -6.7% | -23.9% | -43.3% | -33.1% | -46.5% |

Tom Moeller
AuthorMore in Author Profile »Prior to joining Haver Analytics in 2000, Mr. Moeller worked as the Economist at Chancellor Capital Management from 1985 to 1999. There, he developed comprehensive economic forecasts and interpreted economic data for equity and fixed income portfolio managers. Also at Chancellor, Mr. Moeller worked as an equity analyst and was responsible for researching and rating companies in the economically sensitive automobile and housing industries for investment in Chancellor’s equity portfolio. Prior to joining Chancellor, Mr. Moeller was an Economist at Citibank from 1979 to 1984. He also analyzed pricing behavior in the metals industry for the Council on Wage and Price Stability in Washington, D.C. In 1999, Mr. Moeller received the award for most accurate forecast from the Forecasters' Club of New York. From 1990 to 1992 he was President of the New York Association for Business Economists. Mr. Moeller earned an M.B.A. in Finance from Fordham University, where he graduated in 1987. He holds a Bachelor of Arts in Economics from George Washington University.
More Economy in Brief


