 Global| Jun 10 2004
Australia Employment Maintains Uptrend, Despite Decrease in May
Summary
Labor markets in Australia look prosperous. While this labor force survey shows that the number of people employed fell 41,000 in May, that decline followed sizable rises the two months before. Year-on-year, employment was up 2.0% in [...]
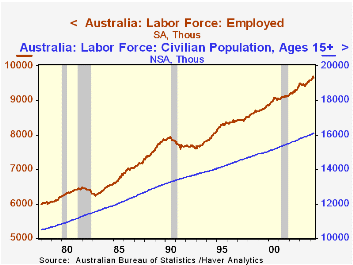
Labor markets in Australia look prosperous. While this labor force survey shows that the number of people employed fell 41,000 in May, that decline followed sizable rises the two months before. Year-on-year, employment was up 2.0% in May, similar to recent increases and a pick-up from the performance through 2003. Just as notably, the unemployment rate has continued to decline, reaching 5.5% in May, the second lowest in the 26-year history of the survey. The lowest reading was 5.4% in June 1981.
In May, the decline in unemployment in the face of falling employment indicates that overall labor force participation was down, and indeed, the participation rate dipped from 63.9% to 63.5% in the month. This could raise skepticism about the ability of the Australian economy to keep its workforce at work. 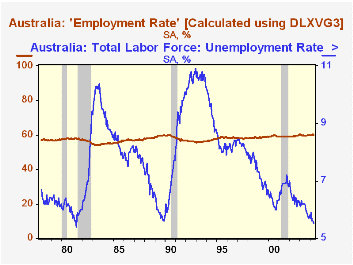 It appears, though, that this is more probably a temporary blip in the data.
One way to assess this is to examine the extent of the population actually employed. Haver's DLXVG3 software allows us to calculate such an "employment rate". Using the two variables, employment (as the primary or "red" series) and population (as the secondary or "blue" series), we can use the Data Transformation capability (Ctrl-T or directly on the command toolbar) to form this rate, as shown in the adjoining graphs. In the second graph, we see that this rate too fell in May, but April's value, 60.4%, was the highest ever, and even the May reduction leaves intact a pronounced uptrend. Australian labor markets are in fact providing job opportunities for record numbers of their population.
| Australia Labor Force Survey | May 2004 | Apr 2004 | Mar 2004 | Year Ago | December/December|||
|---|---|---|---|---|---|---|---|
| 2003 | 2002 | 2001 | |||||
| Employment: Change, Thous | -41 | +62 | +60 | +188 | +153 | +282 | +81 |
| Yr/Yr % Change | 2.0 | 1.6 | 3.0 | 0.9 | |||
| "Employment Rate"*, % | 60.0 | 60.4 | 60.1 | 59.8 | 59.8** | 59.4** | 59.1** |
| Unemployment Rate, % | 5.5 | 5.6 | 5.6 | 6.2 | 6.0** | 6.4** | 6.8** |
| Labor Force: Change, Thous | -55 | +65 | +37 | -1 | +194 | +216 | +151 |
| Yr/Yr % Change | 1.2 | 1.1 | 2.5 | 1.4 |
Carol Stone, CBE
AuthorMore in Author Profile »Carol Stone, CBE came to Haver Analytics in 2003 following more than 35 years as a financial market economist at major Wall Street financial institutions, most especially Merrill Lynch and Nomura Securities. She had broad experience in analysis and forecasting of flow-of-funds accounts, the federal budget and Federal Reserve operations. At Nomura Securities, among other duties, she developed various indicator forecasting tools and edited a daily global publication produced in London and New York for readers in Tokyo. At Haver Analytics, Carol was a member of the Research Department, aiding database managers with research and documentation efforts, as well as posting commentary on select economic reports. In addition, she conducted Ways-of-the-World, a blog on economic issues for an Episcopal-Church-affiliated website, The Geranium Farm. During her career, Carol served as an officer of the Money Marketeers and the Downtown Economists Club. She had a PhD from NYU's Stern School of Business. She lived in Brooklyn, New York, and had a weekend home on Long Island.
More Economy in Brief


