 Global| Jan 05 2007
Another Firm U.S. Payroll Report with Upward Revisions
by:Tom Moeller
|in:Economy in Brief
Summary
During December, nonfarm payrolls grew 167,000 and the prior two month's gains were upwardly revised. The gain easily outpaced Consensus expectations for a 115,000 rise. During 2006 payrolls rose an average 153,000 per month versus a [...]
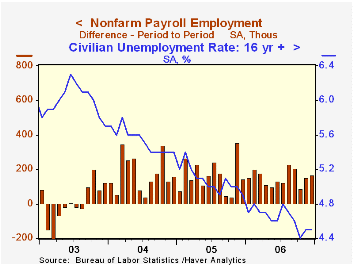
During December, nonfarm payrolls grew 167,000 and the prior two month's gains were upwardly revised. The gain easily outpaced Consensus expectations for a 115,000 rise.
During 2006 payrolls rose an average 153,000 per month versus a monthly average of 165,000 during 2005. The gain during the second half of last year picked up slightly to 161,000 per month.
The unemployment rate held at 4.5% last month. That reflected a solid 303,000 (2.2% y/y) surge in employment and a 326,000 (1.8% y/y) gain in the labor force. For the second month, the number of individuals not in the labor force fell and the y/y change in this measure dropped to zero versus growth in excess of 3% during 2003. That raised the labor force participation rate to 66.4%, the highest level since early 2003.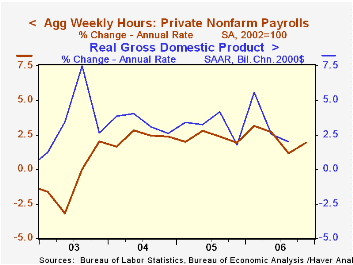
Employment gains as measured by the household survey averaged 262,000 per month last year versus a 219,000 average during 2005.
Jobs in the private sector from the establishment survey rose 150,000 (1.4% y/y) though gains in prior months were revised down slightly. Private service sector jobs rose 161,000 (1.7% y/y) as professional & business services employment rose 50,000 (2.5% y/y) and temporary help services jobs rose 14,600 (-0.6% y/y). Jobs in education & health services rose 43,000 (2.6% y/y) and leisure & hospitality jobs increased 31,000 (2.7% y/y). Financial sector jobs gained just 9,000 (1.9% y/y).
Jobs in the retail sector fell 9,200 last month and for the year were down 57,800 (-0.4%).
Factory sector payrolls fell again. The 12,000 worker decline during December followed a downwardly revised 20,000 drop the prior month and the average monthly decline last year was 6,000. Jobs in motor vehicle & parts industries fell 4,600 (-4.1% y/y) while jobs in furniture fell 2,400 (-4.2% y/y).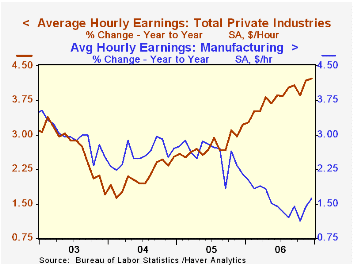
Construction employment fell 3,000 (+0.5% y/y). Since the August peak construction jobs have fallen 0.8%. That decline has been led by a 5.2% drop in residential specialty trade contractors since this group of workers' peak employment month last February.
Government payrolls increased 17,000 (1.1% y/y).
Average hourly earnings nearly doubled the previous month's upwardly revised increase with a 0.5% gain. Factory sector earnings rose 0.3% (1.6% y/y).
The workweek held at the high 33.9 hours, the highest level since 2002. As a result, aggregate hours worked in 4Q rose 2.2% (AR), double the 3Q rate of increase. During the last ten years there has been a 54% correlation between the change in hours and real GDP.
The minutes to the latest FOMC meeting can be found here.
| Employment | December | November | Y/Y | 2006 | 2005 | 2004 |
|---|---|---|---|---|---|---|
| Payroll Employment | 167,000 | 154,000 | 1.4% | 1.4% | 1.5% | 1.1% |
| Manufacturing | -12,000 | -20,000 | -0.5% | -0.1% | -0.6% | -1.3% |
| Average Weekly Hours | 33.9 | 33.9 | 33.8 (Dec. '05) | 33.8 | 33.8 | 33.7 |
| Average Hourly Earnings | 0.5% | 0.3% | 4.2% | 3.8% | 2.8% | 2.1% |
| Unemployment Rate | 4.5% | 4.5% | 4.9% (Dec. '05) | 4.6% | 5.1% | 5.5% |
by Carol Stone January 5, 2007
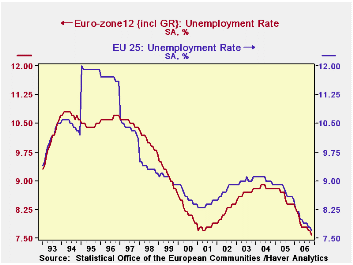
We've been impressed for some time with the evident strength in the European economy. Today, a summary of unemployment data for the entire region for November illustrates this well. The EU-12 group experienced 7.6% unemployment, down from 7.7% in October and the lowest rate recorded since this compilation began in 1993. The previous low was 7.7% during several months in early 2001, just as the tech boom was ending. In November 2005, the rate was 8.4% and the cycle high was 8.9% in the spring of 2004.
In the broader grouping, the EU-25, the current rate is remarkably similar, 7.7%. It too eased 0.1% in November, and it is down from 8.6% a year earlier. We are struck by how closely the broader region's unemployment rate has run to the smaller group's since 1997. The degree of industrialization and development doesn't automatically mean significantly lower unemployment, it seems.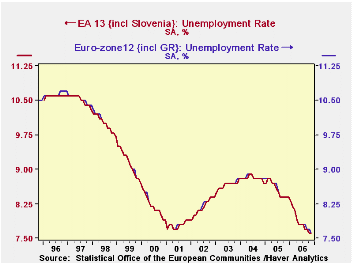
Notably in this release, Eurostat has added data series covering its newly expanded membership. On January 1, Bulgaria and Romania joined the European Union and Slovenia became a member of the Euro-Zone, adopting the euro currency. So the EU25 becomes EU27 and Euro-zone12 becomes Euro-zone13. The "official" aggregates for European data, i.e., the "headline" series, remain the groups of 12 and 25 for purposes of aggregating data through 2006. These will shift to 13 and 27 when data for 2007 start to be reported. Even so, since Eurostat has begun to publish supplemental series for these new aggregates, Haver is adding a select number as temporary series. These, along with other Eurostat data, will be found in the EUROSTAT and G10 databases.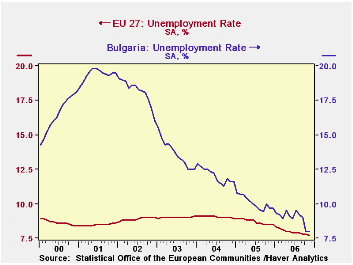
The new series look much like the old, and a quick glance at the three new member countries tells why. Slovenia, the new euro currency user, has lower-than-average unemployment that has declined sharply in the last year. In the wider group of now-27, Bulgaria and Romania both have rates that are presently close to the total, although that for Bulgaria has historically been considerably higher.
| Unemployment Rates (%, Month SA) |
Nov 2006 | Oct 2006 | Sept 2006 | Nov 2005 | 2005 | 2004 | 2003 |
|---|---|---|---|---|---|---|---|
| EA-12 | 7.6 | 7.7 | 7.7 | 8.4 | 8.6 | 8.8 | 8.7 |
| EU-25 | 7.7 | 7.8 | 7.8 | 8.6 | 8.8 | 9.1 | 9.0 |
| -- | -- | -- | -- | -- | -- | -- | |
| EA-13 | 7.6 | 7.6 | 7.7 | 8.4 | 8.6 | 8.8 | 8.7 |
| EU-27 | 7.7 | 7.8 | 7.8 | 8.5 | 8.7 | 9.1 | 9.0 |
| -- | -- | -- | -- | -- | -- | -- | |
| Slovenia | 5.6 | 5.6 | 5.7 | 6.9 | 6.5 | 6.3 | 6.7 |
| Bulgaria | 8.0 | 8.0 | 9.0 | 9.7 | 10.1 | 12.0 | 13.7 |
| Romania | -- | 7.9 | 7.7 | 6.9 | 7.2 | 8.1 | 7.0 |

Tom Moeller
AuthorMore in Author Profile »Prior to joining Haver Analytics in 2000, Mr. Moeller worked as the Economist at Chancellor Capital Management from 1985 to 1999. There, he developed comprehensive economic forecasts and interpreted economic data for equity and fixed income portfolio managers. Also at Chancellor, Mr. Moeller worked as an equity analyst and was responsible for researching and rating companies in the economically sensitive automobile and housing industries for investment in Chancellor’s equity portfolio. Prior to joining Chancellor, Mr. Moeller was an Economist at Citibank from 1979 to 1984. He also analyzed pricing behavior in the metals industry for the Council on Wage and Price Stability in Washington, D.C. In 1999, Mr. Moeller received the award for most accurate forecast from the Forecasters' Club of New York. From 1990 to 1992 he was President of the New York Association for Business Economists. Mr. Moeller earned an M.B.A. in Finance from Fordham University, where he graduated in 1987. He holds a Bachelor of Arts in Economics from George Washington University.
More Economy in Brief


