 Global| Jan 06 2010
ADP Report:U.S. December PayrollEmployment Decline Is Smallest Since March 2008
by:Tom Moeller
|in:Economy in Brief
Summary
Though private sector payrolls fell again last month, the 84,000 worker decline was the least since March 2008. The latest report from the payroll processor ADP, in their National Employment Report, indicated that the December decline [...]
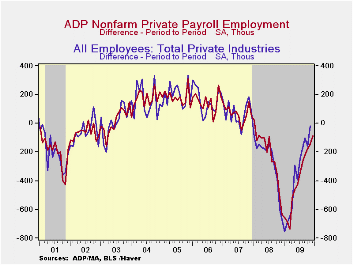 Though
private sector payrolls fell again last month, the 84,000 worker
decline was the least since March 2008. The latest report from the
payroll processor ADP, in their National Employment Report, indicated
that the December decline in private nonfarm payrolls followed a
145,000 November drop that was less than initially reported. The latest
reading was the twenty-third consecutive monthly decline. For 2009 as a
whole payrolls fell by 4.4% which was the sharpest in the series' brief
eight year history.
Though
private sector payrolls fell again last month, the 84,000 worker
decline was the least since March 2008. The latest report from the
payroll processor ADP, in their National Employment Report, indicated
that the December decline in private nonfarm payrolls followed a
145,000 November drop that was less than initially reported. The latest
reading was the twenty-third consecutive monthly decline. For 2009 as a
whole payrolls fell by 4.4% which was the sharpest in the series' brief
eight year history.
ADP
compiled the estimate from its database of individual companies'
payroll information. Macroeconomic Advisers, LLC, the St. Louis
economic consulting firm, developed the methodology for transforming
the raw data into an economic indicator.
ADP reported that the decline in service-producing
industry employment
ended last month with a gain of 12,000 (-2.5% y/y). It was the first
rise since March of 2008. Small-sized payrolls grew 11,000 (-2.1% y/y)
while medium-sized payrolls rose 10,000 (-2.7% y/y). These increases
were offset by a 9,000 decline (-2.8% y/y) in large service producing
payrolls. 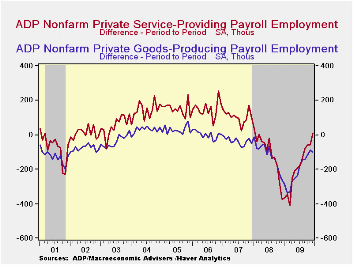 The U.S.
Bureau of Labor
Statistics will report December payroll employment this Friday. For comparison, the November decline of
145,000 in ADP's measure of private nonfarm payrolls was accompanied by
a loss of 18,000 jobs in the BLS measure of private sector payrolls.
According to ADP and Macro-Advisers, the
correlation between the monthly percentage change in the ADP estimate
and that in the BLS data is 0.90.
The U.S.
Bureau of Labor
Statistics will report December payroll employment this Friday. For comparison, the November decline of
145,000 in ADP's measure of private nonfarm payrolls was accompanied by
a loss of 18,000 jobs in the BLS measure of private sector payrolls.
According to ADP and Macro-Advisers, the
correlation between the monthly percentage change in the ADP estimate
and that in the BLS data is 0.90.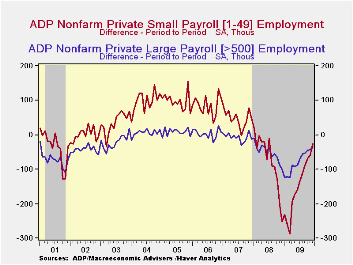 In the
goods
producing sector employment fell 96,000 during December (-12.0% y/y)
and that was deeper than the November drop. Nevertheless, the
three-month annual rate of decline eased again to -6.4% versus -17.3%
at its worst last March. Small-sized payrolls fell 36,000 (-11.9% y/y),
about the same as a 35,000 drop (-11.7% y/y) in medium-sized payrolls.
Large payrolls fell 25,000 (-12.7% y/y). In the manufacturing sector
alone, payrolls fell 43,000 (-11.0% y/y). That was about the same as
the November decline but the three-month change moderated to -4.9% from
-17.4% last March.
In the
goods
producing sector employment fell 96,000 during December (-12.0% y/y)
and that was deeper than the November drop. Nevertheless, the
three-month annual rate of decline eased again to -6.4% versus -17.3%
at its worst last March. Small-sized payrolls fell 36,000 (-11.9% y/y),
about the same as a 35,000 drop (-11.7% y/y) in medium-sized payrolls.
Large payrolls fell 25,000 (-12.7% y/y). In the manufacturing sector
alone, payrolls fell 43,000 (-11.0% y/y). That was about the same as
the November decline but the three-month change moderated to -4.9% from
-17.4% last March.
| ADP National Employment Report | December | November | October | Y/Y | 2009 | 2008 | 2007 |
|---|---|---|---|---|---|---|---|
| Total Nonfarm Private Payroll Employment (m/m Chg., 000s) | -84 | -145 | -178 | -4.2% | -4.4% | -0.5% | 1.2% |
| Small Payroll (1-49) | -25 | -59 | -69 | -3.6 | -3.8 | -0.0 | 1.6 |
| Medium Payroll (50-499) | -25 | -44 | -65 | -4.5 | -5.0 | -0.5 | 1.2 |
| Large Payroll (>500) | -34 | -42 | -44 | -5.0 | -5.1 | -1.6 | -0.1 |
by Tom Moeller January 6, 2010
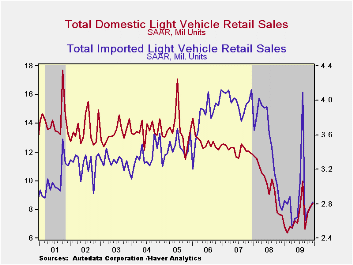
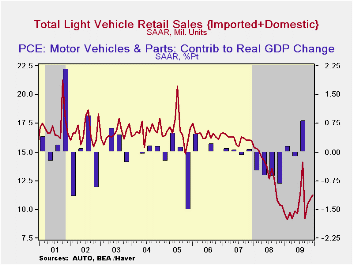 U.S.
unit sales of light vehicles during December
recovered slightly, but by hardly enough to salvage losses earlier in
the year. Sales rose 2.9% m/m to 11.25M units according to the Autodata
Corporation and were slightly stronger than Consensus expectations for
11.0M. To the upside, December sales rose 22.7% from the February '09
low. For the year as a whole, however, sales fell 21.6% from the 2008
average. At 10.37M units vehicle purchases last year were at their
lowest level since 1982. (Seasonal adjustment of these figures is
provided by the U.S. Bureau of Economic Analysis).
U.S.
unit sales of light vehicles during December
recovered slightly, but by hardly enough to salvage losses earlier in
the year. Sales rose 2.9% m/m to 11.25M units according to the Autodata
Corporation and were slightly stronger than Consensus expectations for
11.0M. To the upside, December sales rose 22.7% from the February '09
low. For the year as a whole, however, sales fell 21.6% from the 2008
average. At 10.37M units vehicle purchases last year were at their
lowest level since 1982. (Seasonal adjustment of these figures is
provided by the U.S. Bureau of Economic Analysis).
Sales of domestically made vehicles rose 3.1% last month to 8.42M units. They now have recovered by nearly one-third from the February low but for the year as a whole fell by nearly one-quarter from 2008. Sales of fuel efficient cars rose 9.1% for the month and have risen by nearly one-half from the January low. For the year as a whole sales fell 19.8%. Light truck sales slipped 2.0% m/m during December but were 25.8% above the low. For 2009, sales fell 25.2% as gasoline prices rose.
Imported light vehicle sales rose 2.4% from November to 2.82M and were up 12.4% from the recession low in April. For 2009 sales fell a lesser 18.3% from the 2008 average. Sales of imported autos inched up another 0.8% m/m and 12.1% from the low. Sales for 2009 were 18.2% below 2008 while imported light truck sales rose 5.8% during December and by 12.9% from the low. For all of 2009 imported light trick sales fell 18.5%.
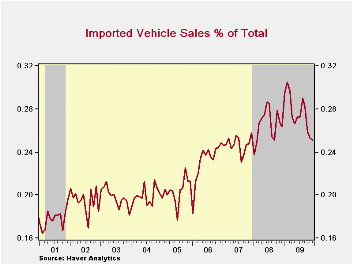
Overall, import's share of the U.S. light vehicle market during December was roughly stable m/m at 25.1%. It reached a new high of 27.6% during all of last year versus 26.5% during 2008. (Imported vehicles are those produced outside the United States.) Imports' share of the U.S. car market totaled 31.5% versus 34.3% during all of last year, which was up just slightly from 2008, while the share of the light truck market was 17.8%, down from 19.6% last year and from 18.3% in 2008.
The U.S. vehicle sales figures can be found in Haver's USECON database.
Automotive Industry Outlook: Understanding the Impact on Workers and Communities from the Federal Reserve Bank of Chicago can be found here.
| Light Vehicle Sales (SAAR, Mil. Units) | December | November | October | Dec. Y/Y | 2009 | 2008 | 2007 |
|---|---|---|---|---|---|---|---|
| Total | 11.25 | 10.93 | 10.46 | 8.7% | 10.37 | 13.22 | 16.16 |
| Autos | 6.01 | 5.65 | 5.50 | 13.9 | 5.46 | 6.76 | 7.58 |
| Domestic | 4.11 | 3.77 | 3.64 | 15.8 | 3.56 | 4.44 | 5.06 |
| Imported | 1.89 | 1.88 | 1.87 | 10.1 | 1.90 | 2.32 | 2.52 |
| Light Trucks | 5.24 | 5.28 | 4.96 | 0.2 | 4.91 | 6.46 | 8.60 |
| Domestic | 4.31 | 4.40 | 4.12 | 2.6 | 3.95 | 5.28 | 7.10 |
| Imported | 0.93 | 0.88 | 0.84 | -10.3 | 0.96 | 1.18 | 1.47 |
by Tom Moeller January 6, 2010
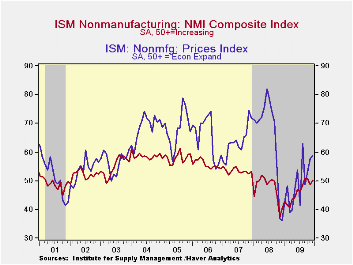 The
nonmanufacturing sector has improved from its worst condition at
year-end 2008 but it has yet to show much expansion. The December
figure from the Institute for Supply Management (ISM) for the service
& construction sectors improved to 50.1 last month
from below the break-even level of 50 during November. The
latest fell just short of Consensus expectations. For the
year as a whole the index reading of 46.3 was the lowest in the series'
history. Since the series' inception in 1997 there has been a 64%
correlation between the level of the composite index in the
nonmanufacturing sector and the q/q change in real GDP for
the services and the construction sectors.
The
nonmanufacturing sector has improved from its worst condition at
year-end 2008 but it has yet to show much expansion. The December
figure from the Institute for Supply Management (ISM) for the service
& construction sectors improved to 50.1 last month
from below the break-even level of 50 during November. The
latest fell just short of Consensus expectations. For the
year as a whole the index reading of 46.3 was the lowest in the series'
history. Since the series' inception in 1997 there has been a 64%
correlation between the level of the composite index in the
nonmanufacturing sector and the q/q change in real GDP for
the services and the construction sectors.
ISM surveys more than 370 purchasing managers in more than 62 industries including law firms, hospitals, government and retailers. The nonmanufacturing survey dates back to July 1997. The figures are available in Haver's USECON database.
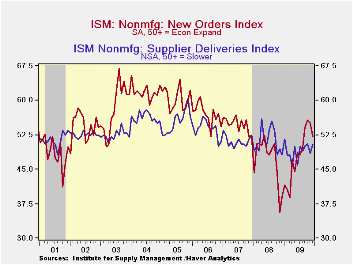
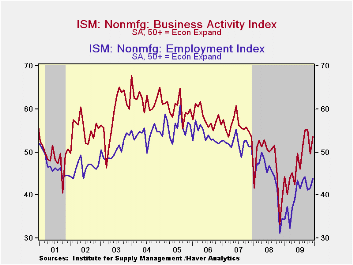 Amongst
the components, the business activity
index for the service sector moved back above break-even at 53.7 and
that was up sharply from one year ago. Also, the employment index
improved for the second month and was up sharply from its low in
November 2008. Since the series' inception in 1997 there has been an
80% correlation between the level of the ISM nonmanufacturing
employment index and the m/m change in payroll employment in the
service-producing plus the construction industries. Countering
these gains were declines in the new orders and the speed of vendor
deliveries indexes. This latter reading indicates that delivery speeds
quickened.
Amongst
the components, the business activity
index for the service sector moved back above break-even at 53.7 and
that was up sharply from one year ago. Also, the employment index
improved for the second month and was up sharply from its low in
November 2008. Since the series' inception in 1997 there has been an
80% correlation between the level of the ISM nonmanufacturing
employment index and the m/m change in payroll employment in the
service-producing plus the construction industries. Countering
these gains were declines in the new orders and the speed of vendor
deliveries indexes. This latter reading indicates that delivery speeds
quickened.
 Pricing
power improved for the third straight month, but
just slightly. The pricing index rose m/m to 58.7 and was up sharply
from one year ago. Since its inception ten years ago, there has been a
73% correlation between the price index and the q/q change in the GDP
services chain price index.
Pricing
power improved for the third straight month, but
just slightly. The pricing index rose m/m to 58.7 and was up sharply
from one year ago. Since its inception ten years ago, there has been a
73% correlation between the price index and the q/q change in the GDP
services chain price index.
Beginning with the January 2008 Nonmanufacturing Report On Business®, the composite index is calculated as an indicator of the overall economic condition for the non-manufacturing sector. It is a composite index based on the diffusion indices of four of the indicators (business activity, new orders, employment and supplier deliveries) with equal weights. The latest report from the ISM can be found here.
News About the Future and Economic Fluctuations from the Federal Reserve Bank of Philadelphia is available here.
| ISM Nonmanufacturing Survey | December | November | October | Dec. '08 | 2009 | 2008 | 2007 |
|---|---|---|---|---|---|---|---|
| Composite Index | 50.1 | 48.7 | 50.6 | 40.1 | 46.3 | 47.4 | 53.5 |
| Business Activity | 53.7 | 49.6 | 55.2 | 38.9 | 48.1 | 47.4 | 56.0 |
| New Orders | 52.1 | 55.1 | 55.6 | 38.9 | 48.0 | 47.0 | 54.8 |
| Employment | 44.0 | 41.6 | 41.1 | 34.5 | 40.0 | 43.8 | 52.0 |
| Supplier Deliveries | 50.5 | 48.5 | 50.5 | 48.0 | 49.0 | 51.1 | 51.1 |
| Prices Index | 58.7 | 57.8 | 53.0 | 36.1 | 49.4 | 66.0 | 63.8 |
by Tom Moeller January 6, 2010
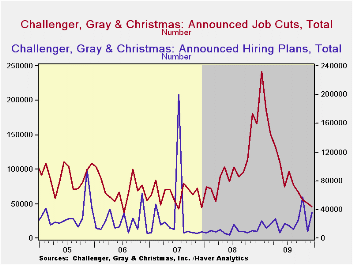 Labor market
improvement is counted as fewer jobs lost and more jobs gained. Both
were indicated for December by the outplacement firm of Challenger,
Grey & Christmas Their measure of job cut announcements fell
last month to 45,094, compared to a high of 241,748 in January of last
year. The latest reading was the least number of layoffs since December
2007. Layoffs moderated in the construction, consumer goods, financial,
health care, retail, services and transportation industries. They rose
in the apparel and in the industrial goods industries.
Labor market
improvement is counted as fewer jobs lost and more jobs gained. Both
were indicated for December by the outplacement firm of Challenger,
Grey & Christmas Their measure of job cut announcements fell
last month to 45,094, compared to a high of 241,748 in January of last
year. The latest reading was the least number of layoffs since December
2007. Layoffs moderated in the construction, consumer goods, financial,
health care, retail, services and transportation industries. They rose
in the apparel and in the industrial goods industries.
Challenger also samples firms' hiring plans. During December
plans
recouped the November decline and were more than triple the year-ago
level.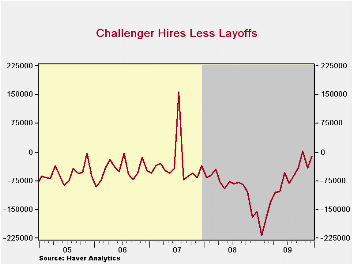 Plans picked up sharply in the financial and aerospace/defense
industries but more moderately in the government and insurance
industries. The net of hires less layoffs was near its least 2007.
Plans picked up sharply in the financial and aerospace/defense
industries but more moderately in the government and insurance
industries. The net of hires less layoffs was near its least 2007.
During the last ten years there has been a 67% (inverse) correlation between the three-month moving average of announced job cuts and the three-month change payroll employment. Job cut announcements differ from layoffs. Many are achieved through attrition, early retirement or just never occur.
The Challenger figures are available in Haver's SURVEYS database.
The Recession in Perspective from the Federal Reserve Bank of Minneapolis can be found here.
| Challenger, Gray & Christmas | December | November | October | Y/Y | 2009 | 2008 | 2007 |
|---|---|---|---|---|---|---|---|
| Announced Job Cuts | 45,094 | 50,349 | 55,679 | -72.9% | 1,288,030 | 1,223,993 | 768,264 |
| Announced Hiring Plans | 35,592 | 10,076 | 57,520 | 253.0 | 272,573 | 118,600 | 365,583 |
by Robert Brusca January 6, 2010
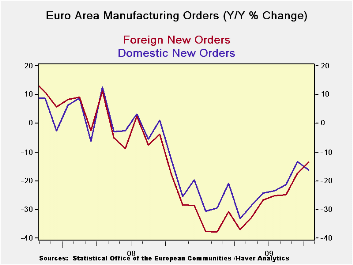
Total orders in the EMU area have fallen m/m in October after six straight months of increasing. The Yr/Yr drop in orders is a still substantial 15.2%. Foreign orders Yr/Yr are off by 13.4% while domestic orders are off by 16.1%. Over three months the Zone’s domestic orders are much weaker, falling at a 15.6% pace compared to foreign orders that are off by just 3.5%. Over six months domestic orders and foreign orders are up, and foreign orders are up on that span at a 20% annual rate.
Country detail shows that Germany leads the EMU parade among large economies. Its orders are still up by 3.5% over three months despite a dip in October. Still all large EU countries are showing a fall off in orders growth over three months compared to six months.
In a December report released today the Markit services indices showed that despite this MFG order weakness in October the services sector in EMU continued to improve though year-end. The EMU services sector diffusion index from Markit moved up to 53.63 in Dec. from 53.04 in Nov. While down on the month France shows the most strength in the service sector among large EMU members
Still, the MFG sector is the cyclical one and orders data, though lagging, show that some softening was occurring in October. The more up-to-date market MFG diffusion surveys show us that MFG progress has continued though year end but has slowed. EMU is being pulled along by demand from outside of the region. Export orders continue to be the driving the EMU expansion. Yet, the EMU currency, the euro, continues to be high-valued, even if off peak, giving reason to wonder how long the e-zone will be able to continue to be pulled ahead by its external sector.
| Euro Area and UK Industrial Orders & Sales Trends | |||||||||
|---|---|---|---|---|---|---|---|---|---|
| Saar except m/m | % m/m | Oct 09 |
Oct 09 |
Oct 09 |
Oct 08 |
Oct 07 |
Qtr-2 Date |
||
| Euro Area Detail | Oct 09 |
Sep 09 |
Aug 09 |
3Mo | 6mo | 12mo | 12mo | 12mo | Saar |
| MFG Sales | 0.3% | -0.8% | 2.0% | 6.0% | 4.8% | -14.2% | -3.0% | 6.4% | 2.4% |
| Intermediate | -7.1% | 6.7% | -3.3% | -15.6% | 8.6% | -16.1% | -3.6% | 8.6% | 9.2% |
| MFG Orders | |||||||||
| Total Orders | -2.2% | 1.7% | 0.5% | -0.4% | 18.3% | -12.2% | -15.2% | 8.1% | -5.8% |
| E-13 Domestic MFG orders | -7.1% | 6.7% | -3.3% | -15.6% | 8.6% | -16.1% | -12.6% | 8.8% | -22.3% |
| E-13 Foreign MFG orders | -2.6% | 7.2% | -5.1% | -3.5% | 20.1% | -13.4% | -17.6% | 14.8% | 1.4% |
| Countries: | Oct 09 |
Sep 09 |
Aug 09 |
3Mo | 6mo | 12mo | 12mo | 12mo | Qtr-2 Date |
| Germany: | -2.6% | 1.5% | 2.5% | 5.5% | 25.0% | -12.6% | -17.3% | 11.3% | -4.7% |
| France: | -9.2% | 4.9% | 2.7% | -8.5% | 5.7% | -9.8% | -16.8% | 5.7% | -28.6% |
| Italy | 0.3% | 5.5% | -8.7% | -12.6% | 5.9% | -15.4% | -14.6% | 5.6% | 5.2% |
| UK(EU) | 11.4% | 1.6% | -11.7% | -0.1% | 45.3% | 1.0% | -9.0% | 4.9% | 57.4% |

Tom Moeller
AuthorMore in Author Profile »Prior to joining Haver Analytics in 2000, Mr. Moeller worked as the Economist at Chancellor Capital Management from 1985 to 1999. There, he developed comprehensive economic forecasts and interpreted economic data for equity and fixed income portfolio managers. Also at Chancellor, Mr. Moeller worked as an equity analyst and was responsible for researching and rating companies in the economically sensitive automobile and housing industries for investment in Chancellor’s equity portfolio. Prior to joining Chancellor, Mr. Moeller was an Economist at Citibank from 1979 to 1984. He also analyzed pricing behavior in the metals industry for the Council on Wage and Price Stability in Washington, D.C. In 1999, Mr. Moeller received the award for most accurate forecast from the Forecasters' Club of New York. From 1990 to 1992 he was President of the New York Association for Business Economists. Mr. Moeller earned an M.B.A. in Finance from Fordham University, where he graduated in 1987. He holds a Bachelor of Arts in Economics from George Washington University.
More Economy in Brief


