 Global| Feb 03 2010
ADP Report: Payroll Employment Decline Continues To Shrink
by:Tom Moeller
|in:Economy in Brief
Summary
There's no gain in payroll levels yet, but the shrinkage continued to lessen last month. The latest report from the payroll processor ADP, in their National Employment Report, indicated that January nonfarm payroll levels declined [...]
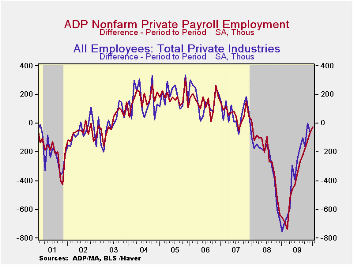 There's
no
gain in payroll levels yet, but the shrinkage continued to lessen last
month. The latest report from the payroll processor ADP, in their
National Employment Report, indicated that January nonfarm payroll
levels declined 22,000 following a revised 61,000 December drop that
was less than initially reported. The latest reading was the
twenty-fourth consecutive monthly decline.
There's
no
gain in payroll levels yet, but the shrinkage continued to lessen last
month. The latest report from the payroll processor ADP, in their
National Employment Report, indicated that January nonfarm payroll
levels declined 22,000 following a revised 61,000 December drop that
was less than initially reported. The latest reading was the
twenty-fourth consecutive monthly decline.
ADP compiled the estimate from its database of individual companies' payroll information. Macroeconomic Advisers, LLC, the St. Louis economic consulting firm, developed the methodology for transforming the raw data into an economic indicator.
The U.S. Bureau of Labor Statistics will report January payroll employment this Friday. For comparison, the December decline of 61,000 in ADP's measure of private nonfarm payrolls was accompanied by a similar loss of 64,000 jobs in the BLS measure of private sector payrolls. According to ADP and Macro-Advisers, the correlation between the monthly percentage change in the ADP estimate and that in the BLS data is 0.90.
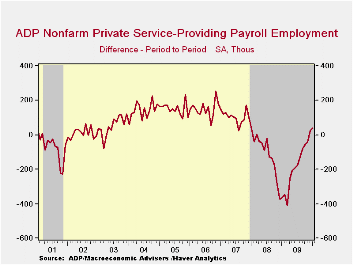
ADP reported that service-producing industry employment rose for the second consecutive month with a gain of 38,000 (-2.0% y/y). Small-sized payrolls grew 16,000 (-1.7% y/y) while medium-sized payrolls grew a larger 22,000 (-2.2% y/y). These increases were accompanied by no-change (-2.3% y/y) in large service producing payrolls.
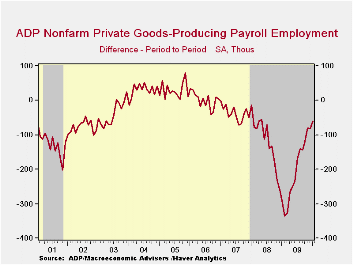
In the goods producing sector employment fell another 60,000 during January (-10.9% y/y). The three-month annual rate of decline eased again to -4.8% versus -17.3% at its worst last March. Small-sized payrolls fell 28,000 (-11.1% y/y) while medium-sized payrolls fell 13,000 (-10.3% y/y). Large payrolls fell 19,000 (-11.9% y/y). In the manufacturing sector alone, payrolls fell 25,000 (-9.8% y/y). That was the easiest m/m decline in two years and the three-month change moderated to -3.5% from -17.4% last March.
The ADP National Employment Report data is maintained in Haver's USECON database; historical figures date back to December 2000. The figures in this report cover only private sector jobs and exclude employment in the public sector. The full ADP National Employment Report can be found here and the ADP methodology is explained here.
| ADP National Employment Report | January | December | November | Y/Y | 2009 | 2008 | 2007 |
|---|---|---|---|---|---|---|---|
| Total Nonfarm Private Payroll Employment (m/m Chg., 000s) | -22 | -61 | -121 | -3.6% | -4.4% | -0.5% | 1.2% |
| Small Payroll (1-49) | -12 | -17 | -50 | -3.1 | -3.7 | -0.0 | 1.6 |
| Medium Payroll (50-499) | 9 | -16 | -37 | -3.8 | -5.0 | -0.5 | 1.2 |
| Large Payroll (>500) | -19 | -28 | -34 | -4.4 | -5.1 | -1.6 | -0.1 |
by Tom Moeller February 3, 2010
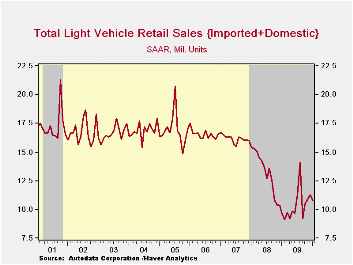 The
beginning of the new year brought an attempt by car-makers to back away
from end-of-year sales promotions. As a result, higher prices as well
as reduced inventories caused U.S. unit sales of
light vehicles during January to fall. According to the
Autodata corporation, the decline to a seasonally adjusted 10.78M units
from 11.25M in December nevertheless left sales up 12.1% from last
January when the recession was near its depths. Sales were slightly
weaker than Consensus expectations for 11.0M. (Seasonal adjustment of
these figures is provided by the U.S. Bureau of Economic Analysis).
The
beginning of the new year brought an attempt by car-makers to back away
from end-of-year sales promotions. As a result, higher prices as well
as reduced inventories caused U.S. unit sales of
light vehicles during January to fall. According to the
Autodata corporation, the decline to a seasonally adjusted 10.78M units
from 11.25M in December nevertheless left sales up 12.1% from last
January when the recession was near its depths. Sales were slightly
weaker than Consensus expectations for 11.0M. (Seasonal adjustment of
these figures is provided by the U.S. Bureau of Economic Analysis).
Sales of domestically made vehicles fell 6.4% last month to 7.88M units from 8.42M in December. Sales of fuel efficient cars fell 8.2% for the month (+30.3% y/y) following strength during December. Light truck sales similarly fell 4.7% m/m to the lowest level since September.
Contrary to the declines in domestics, imported light vehicle sales mirrored their December gain with a 2.5% m/m increase. The rise to 2.90M was to the highest level since August and raised them 2.2% y/y. Sales of imported autos inched up another 1.5% m/m while light truck sales rose 4.6% during January and by 18.0% from last year's low.
Overall, import's share of the U.S. light vehicle market during January improved m/m to 26.9%. That was its highest level since September but still down from its high of 27.6% during all of last year. (Imported vehicles are those produced outside the United States.) Imports' share of the U.S. car market improved m/m to 33.7% but that still was below 34.3% during all 2009. Imports' share of the light truck market rose m/m to 19.1%, roughly stable with 19.6% last year.
The U.S. vehicle sales figures can be found in Haver's USECON database.
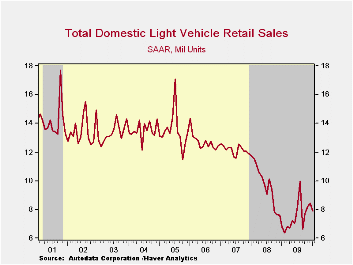
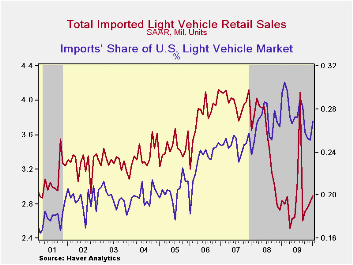
| Light Vehicle Sales (SAAR, Mil. Units) | January | December | November | Jan. Y/Y | 2009 | 2008 | 2007 |
|---|---|---|---|---|---|---|---|
| Total | 10.78 | 11.25 | 10.93 | 12.1% | 10.37 | 13.22 | 16.16 |
| Autos | 5.70 | 6.01 | 5.65 | 21.6 | 5.46 | 6.76 | 7.58 |
| Domestic | 3.78 | 4.11 | 3.77 | 30.3 | 3.56 | 4.44 | 5.06 |
| Imported | 1.92 | 1.89 | 1.88 | 7.6 | 1.90 | 2.32 | 2.52 |
| Light Trucks | 5.08 | 5.24 | 5.28 | 3.1 | 4.91 | 6.46 | 8.60 |
| Domestic | 4.11 | 4.31 | 4.40 | 5.8 | 3.95 | 5.28 | 7.10 |
| Imported | 0.97 | 0.93 | 0.88 | -7.1 | 0.96 | 1.18 | 1.47 |
by Tom Moeller February 3, 2010
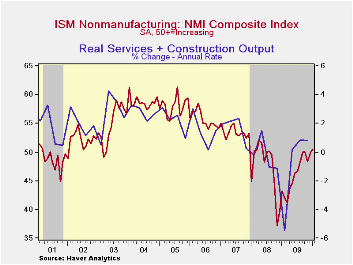 There's
been little expansion but less contraction in the nonmanufacturing
sector. That's the message from the Institute for Supply Management
(ISM) for the service & construction sectors. Their Composite
Index ticked up to 50.5 from a downwardly revised 49.8 during December.
Material improvement is indicated by the rise in the series from a low
of 37.2 late in 2008. The latest figure about matched Consensus
expectations. Since the series' inception in 1997 there has been a 65%
correlation between the level of the composite index in the
nonmanufacturing sector and the q/q change in real GDP for the services
and the construction sectors.
There's
been little expansion but less contraction in the nonmanufacturing
sector. That's the message from the Institute for Supply Management
(ISM) for the service & construction sectors. Their Composite
Index ticked up to 50.5 from a downwardly revised 49.8 during December.
Material improvement is indicated by the rise in the series from a low
of 37.2 late in 2008. The latest figure about matched Consensus
expectations. Since the series' inception in 1997 there has been a 65%
correlation between the level of the composite index in the
nonmanufacturing sector and the q/q change in real GDP for the services
and the construction sectors.
ISM surveys more than 370 purchasing managers in more than 62 industries including law firms, hospitals, government and retailers. The nonmanufacturing survey dates back to July 1997. The figures are available in Haver's USECON database.
Amongst the components, the business activity index for the service sector was above break-even for the fifth month in the last six. The new orders index was even stronger as it posted a rise to the highest level since June of 2007. Also, the employment index improved to the highest level since August 2008 and was up sharply from its low at the end of that year. Since the series' inception in 1997 there has been an 80% correlation between the level of the ISM nonmanufacturing employment index and the m/m change in payroll employment in the service-producing plus the construction industries.
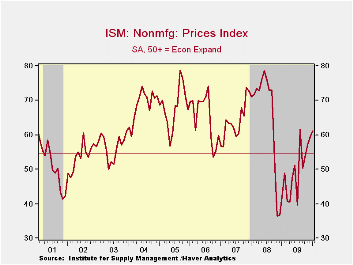
As activity improved, pricing power did as well with a rise for the fourth straight month to near the highest level since September 2008. The pricing index rose m/m to 58.7 and was up sharply from one year ago. Since its inception ten years ago, there has been a 73% correlation between the price index and the q/q change in the GDP services chain price index.
Beginning with the January 2008 Nonmanufacturing Report On Business ®, the composite index is calculated as an indicator of the overall economic condition for the non-manufacturing sector. It is a composite index based on the diffusion indices of four of the indicators (business activity, new orders, employment and supplier deliveries) with equal weights. The latest report from the ISM can be found here.
Recessions Happen: Now What? from the Federal Reserve Bank of St. Louis is available here here.
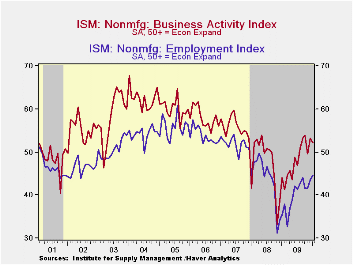
| ISM Nonmanufacturing Survey | January | December | November | Jan. '09 | 2009 | 2008 | 2007 |
|---|---|---|---|---|---|---|---|
| Composite Index | 50.5 | 49.8 | 48.4 | 43.2 | 46.2 | 47.3 | 53.5 |
| Business Activity | 52.2 | 53.2 | 49.6 | 44.1 | 48.0 | 47.4 | 56.0 |
| New Orders | 54.7 | 52.0 | 53.7 | 41.6 | 47.9 | 47.0 | 54.8 |
| Employment | 44.6 | 43.6 | 41.7 | 35.4 | 39.9 | 43.8 | 52.0 |
| Supplier Deliveries | 50.5 | 50.5 | 48.5 | 51.5 | 49.0 | 51.1 | 51.1 |
| Prices Index | 61.2 | 59.6 | 57.1 | 42.1 | 49.4 | 66.0 | 63.8 |
by Tom Moeller February 3, 2010
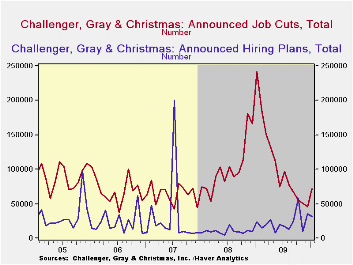
Earlier labor market improvement paused last month as announced job cuts rose and hiring plans fell, according to the outplacement firm of Challenger, Grey & Christmas. Their measure of job cut announcements increased last month to 71,482 but that still was well below the high of 241,748 in January of last year. Layoffs increased sharply in the pharmaceutical, retail and telecommunications industries.
Challenger also samples firms' hiring plans. During January, plans fell slightly m/m but were up nearly one-third from the year-ago level. Plans picked up sharply in the electronics and entertainment/leisure industries. The net of hires less layoffs fell slightly m/m but remained near its ebb in 2007.
During the last ten years there has been a 67% (inverse) correlation between the three-month moving average of announced job cuts and the three-month change payroll employment. Job cut announcements differ from layoffs. Many are achieved through attrition, early retirement or just never occur.
The Challenger figures are available in Haver's SURVEYS database.
The Recession in Perspective from the Federal Reserve Bank of Minneapolis can be found here.
| Challenger, Gray & Christmas | January | December | November | Y/Y | 2009 | 2008 | 2007 |
|---|---|---|---|---|---|---|---|
| Announced Job Cuts | 71,482 | 45,094 | 50,349 | -70.4% | 1,288,030 | 1,223,993 | 768,264 |
| Announced Hiring Plans | 31,381 | 35,592 | 10,076 | 30.9 | 272,573 | 118,600 | 365,583 |
by Robert Brusca February 3, 2010
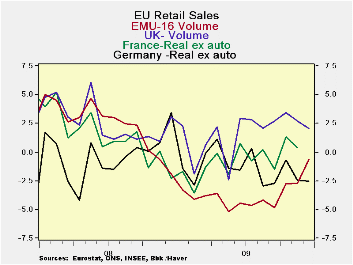
EMU areas retail sales continue to disappoint. Sales edged up in December and were revised higher in earlier months, infusing the series with some good news to help paper over the month of December’s poor showing. The sequential growth rates show that the value of retail sales is increasing gradually from a -2.3% pace over 12-months to a -0.2% annual pace over six-months to a +1% pace over three-months. But motor vehicle registrations are backsliding now that the major government incentive plans have had their impact.
Both Germany and the UK, large EU area economies, are showing some stability in their respective retail sales. But there is no lift or punch from the consumer. It is good to see that the drag on growth from the consumer is being put behind it. But there is no thrust propelling growth forward.
Quite apart from economists’ estimates we can look at retail sales in EMU with a kinder gentler eye. While job growth is still being undermined and consumer confidence is still shaky, getting consumer spending to stabilize is good news. It is the sort of thing that Europe’s social welfare state is supposed to achieve in times like this.
The problem for Europe is that its rate of unemployment is structurally higher than in the US. And With consumers and businesses in Europe still concerned about future unemployment, the actual rate could creep higher still while the US rate that has ratcheted higher drops sharply (sharply by the standards of unemployment rates, that is). Already European governments are using moral suasion to try to get firms not to lay off more workers and worsen their business cycle. Europe’s social welfare system does provide it with some buffers but those buffers are also modifiers to the economy’s ability to mount recovery once an economic crisis begins to pass.
Europe still labors under many problems. I sit back and wonder how long the recent disgraceful; episode with Greece will go on. If we did not know it before, we are finding out that it not possible to have a currency union- a monetary union- without also a fiscal union as well. EMU sought to trick the laws of economics and prudence when it was formed. Perhaps that is why it adopted a fiscal criterion called the mass-trick (Maastricht). It sought to replace a true fiscal union with a set of rules that are to be ‘;binding’ in manner that is not specified. In that way Europeans could have their cake and eat it too. There would be monetary union and no need to mesh together national priorities. National autonomy could coexist with monetary union, or so they supposed. Early in the game Italy defied these rules by using asset sales to make its deficits seem to correspond with the strictures imposed by rules. Upon its entry Greece had managed to hide the extent of its indebtedness. But business cycles have a way of bringing out the truth-especially when it is a harsh truth and now Greece is out of kilter again.
We find Europe in much the same state as were banks in the financial crisis with off balance sheet liabilities that came back home to roost on their balance sheet where they never supposed to reside. Europe – and its darling, the euro- has the weight of Greece to bear. For its part Greece has set out a very tough program to get back where it needs to get. Yet, it is not clear that this plan will work or that Greece will be able to stick to it long enough to find out if it does work. If Greece’s plan fails for any reason what then? Does the EU step in to help it? If so, what precedent does that set? If not what then? Blowing Greece of out the EMU would certainly not be the end of the damage from such a move.
Maybe, short of a full fiscal union, Europe needs a to tax members to fund an adjustment facility with some draconian conditions to assure that members don’t seek to use it too often.
In any event Europe is caught in the great lie of the euro-Area. That lie says you can have a monetary union without fiscal harmony. One corollary is that fiscal separateness is exactly that; regardless of the rules meant to bind. If fiscal policies are under different national domains they will be different and in time they will drift too far apart. Without a common fiscal pool and common currency the issue of breakdowns and leakages will come to the surface and zone participants will be forced to make the hard decisions they tried to avoid when they concocted the system that doesn’t make sense: the euro zone. It could yet work out the way they laid it out, but as we can see, it probably won’t.
| Euro-Area Retail Sales | ||||||
|---|---|---|---|---|---|---|
| M/M | Saar | |||||
| Dec-09 | Nov-09 | Oct-09 | 3-Mo | 6-MO | 12-Mo | |
| Zone Total Value | 0.1% | 0.1% | 0.0% | 1.0% | -0.2% | -2.3% |
| Food,Bev Tobacco | -0.1% | -0.1% | -0.2% | -1.8% | -2.1% | -2.1% |
| NonFood | -0.1% | -1.2% | 0.4% | -4.4% | -1.8% | -3.0% |
| Registrations: | ||||||
| Motor Vehicle Reg | -3.0% | 1.0% | 0.6% | -5.4% | 0.1% | 19.9% |
| NonFood Country detail: Volume | ||||||
| Germany Value | 0.8% | -1.7% | 0.9% | 0.0% | 0.4% | -2.5% |
| UK(EU) Volume | 0.4% | -0.3% | 0.5% | 2.5% | 2.3% | 2.1% |

Tom Moeller
AuthorMore in Author Profile »Prior to joining Haver Analytics in 2000, Mr. Moeller worked as the Economist at Chancellor Capital Management from 1985 to 1999. There, he developed comprehensive economic forecasts and interpreted economic data for equity and fixed income portfolio managers. Also at Chancellor, Mr. Moeller worked as an equity analyst and was responsible for researching and rating companies in the economically sensitive automobile and housing industries for investment in Chancellor’s equity portfolio. Prior to joining Chancellor, Mr. Moeller was an Economist at Citibank from 1979 to 1984. He also analyzed pricing behavior in the metals industry for the Council on Wage and Price Stability in Washington, D.C. In 1999, Mr. Moeller received the award for most accurate forecast from the Forecasters' Club of New York. From 1990 to 1992 he was President of the New York Association for Business Economists. Mr. Moeller earned an M.B.A. in Finance from Fordham University, where he graduated in 1987. He holds a Bachelor of Arts in Economics from George Washington University.
More Economy in Brief


