 Global| May 31 2006
ADP Nat'l Employment Report: Slimmer Gain in May Payrolls
by:Tom Moeller
|in:Economy in Brief
Summary
The Nat'l Employment Report published by ADP, the payroll processors for many employers, indicated that nonfarm private payrolls in May increased 122,000. For April, a 178,000 rise in ADP's nonfarm private payrolls was accompanied by [...]
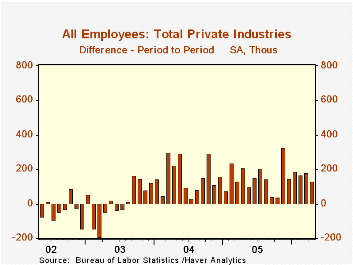
The Nat'l Employment Report published by ADP, the payroll processors for many employers, indicated that nonfarm private payrolls in May increased 122,000.
For April, a 178,000 rise in ADP's nonfarm private payrolls was accompanied by a 131,000 rise private nonfarm payrolls as published by the Bureau of Labor Statistics. The May figure from BLS will be published Friday.
ADP has compiled the estimate from its database of individual companies' payroll information. Macroeconomic Advisers, LLC, the St. Louis economic consulting firm, developed the methodology for transforming the raw data into an economic indicator.
According to ADP and Macro Advisers, the correlation between the monthly percentage change in the ADP estimate and that in the BLS data is 0.90.
The ADP National Employment Report data is maintained in Haver's USECON database; historical data go back to December 2000. The figures in this report cover only private sector jobs and exclude employment in the public sector, which grew an average of 11,333 per month over the last year.
The full ADP National Employment Report can be found here, and the ADP methodology is explained here.
| LAXEPA@USECON | May | April | Y/Y | 2005 | 2004 | 2003 |
|---|---|---|---|---|---|---|
| Nonfarm Private Payroll Employment (Chg.) | 122,000 | 178,000 | 1.9% | 1.7% | 1.3% | -0.4% |
by Tom Moeller May 31, 2006
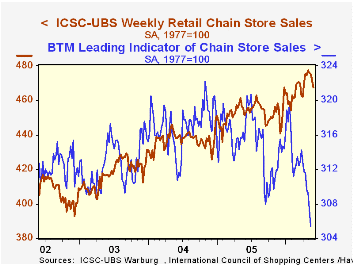
Chain store sales fell sharply last week. The 1.0% w/w decline followed a similar 0.8% drop the prior week, reported the International Council of Shopping Centers (ICSC)-UBS.
Declines during three of the four weeks this month pulled the average level of May sales down 0.6% from the April average which rose 1.6% from March. During the last ten years there has been a 47% correlation between the y/y change in chain store sales and the change in nonauto retail sales less gasoline.The ICSC-UBS retail chain-store sales index is constructed using the same-store sales (stores open for one year) reported by 78 stores of seven retailers: Dayton Hudson, Federated, Kmart, May, J.C. Penney, Sears and Wal-Mart.
The leading indicator of chain store sales from ICSC-UBS continued its recent decline with another 0.6% drop. The indicator was down 2.7% versus one year ago and 4.5% from the recent peak in early January.
Inflation, Banking and Economic Growth from the Federal Reserve Bank of Cleveland can be found here.
| ICSC-UBS (SA, 1977=100) | 05/27/06 | 05/20/06 | Y/Y | 2005 | 2004 | 2003 |
|---|---|---|---|---|---|---|
| Total Weekly Chain Store Sales | 467.5 | 472.0 | 3.6% | 3.6% | 4.7% | 2.9% |
by Tom Moeller May 31, 2006
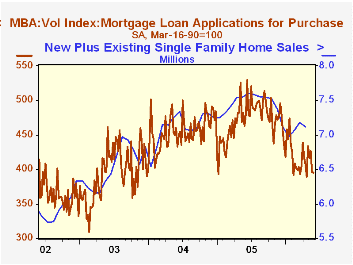
The total number of mortgage applications fell another 1.9% last week on the heels of the prior week's 6.0% decline. The weakness dropped the average level in May 2.2% below April and 30.0% below last June.
Purchase applications fell another 0.2% w/w after the 7.1% w/w drop the prior week. That lowered the May average 0.8% versus April and 17.5% versus last July.
During the last ten years there has been a negative 80% correlation between the interest rate level on 30-year financing and purchase applications while during those years there has been a 54% correlation between the y/y change in purchase applications and the change in new plus existing single family home sales.
A 4.8% w/w drop in applications to refinance added to the 4.3% decline during the prior week. That lowered the May level 4.1% below the April average which fell 4.1% from March. The May level was 43.8% below last June.
The effective interest rate on a conventional 30-year mortgage backed up two basis points to 6.86% and left the May average at 6.86%, up sharply from the 5.81% low last June. The rate on 15-year financing was stable at 6.52%. Interest rates on 15 and 30 year mortgages are closely correlated (>90%) with the rate on 10 year Treasury securities and during the last ten years there has been a (negative) 82% correlation between purchase applications and the effective rate on a 30-Year mortgage.
The Mortgage Bankers Association surveys between 20 to 35 of the top lenders in the U.S. housing industry to derive its refinance, purchase and market indexes. The weekly survey accounts for more than 40% of all applications processed each week by mortgage lenders. Visit the Mortgage Bankers Association site here.
Inversion, a speech by St. Louis Federal Reserve Bank President William Poole, can be found here.
| MBA Mortgage Applications (3/16/90=100) | 05/26/06 | 05/19/06 | Y/Y | 2005 | 2004 | 2003 |
|---|---|---|---|---|---|---|
| Total Market Index | 541.9 | 552.6 | -23.6% | 708.6 | 735.1 | 1,067.9 |
| Purchase | 395.5 | 396.4 | -14.5% | 470.9 | 454.5 | 395.1 |
| Refinancing | 1,409.0 | 1,480.5 | -34.2% | 2,092.3 | 2,366.8 | 4,981.8 |
by Carol Stone May 31, 2006
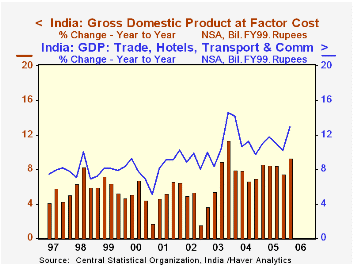
Economic growth in South Asia was firm in Q1, according to reports out today from government statistics offices in India, Malaysia and Philippines. India, especially, with a 9.3% year/year gain in GDP, saw its strongest quarter since the end of 2003. In Malaysia, growth appears uneventful, with year-on-year gains hovering between 5% and 7%, but after the steep recession of 1998 and the slowdown in 2001, this looks attractive. In the Philippines, the latest quarter was up a modest 0.8% from Q4 but 5.5% from the year earlier. This pace compares to a 4.9% average over the past 5 years. 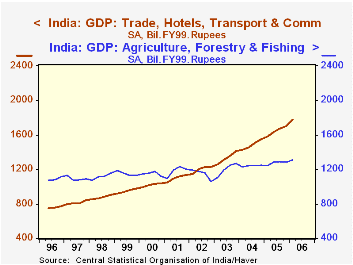
In India, agriculture continues to dominate the economy, although as seen in the second graph, the trade and transport sector surpassed it in 2002; that industrial segment also continues to grow rapidly now, surging 12.9% in Q1. The same group also includes hotels and communications; we'd suspect that as the Indian infrastructure builds, "communications" would be expanding rapidly. The same holds for construction; it is smaller in absolute size, but has sustained better than 10% average growth for the last five years. Other sectors are chasing along, too. Manufacturing gained 8.9% over the last four quarters, while finance, insurance and business services was up 10.8%.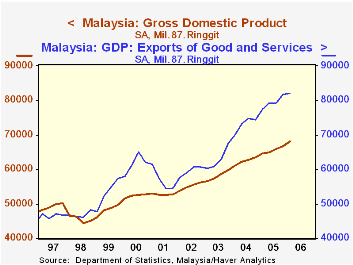
The Malaysian economy has the interesting feature that exports are larger than total GDP -- by a sizable amount. In Q1, exports were 82.0 billion ringgit (1987 prices) while GDP was 68.1 billion. See the third graph. Imports are sizable too, of course, at 77.8 billion ringgit. So goods and services are imported into the country, processed, and shipped out. This chain of events yielded GDP growth of 2.2% in Q1 alone (from Q4), the largest single quarter since early 2000. The domestic economy is fairly vibrant; it expanded 5.7% in the quarter, pushed by an 11.1% surge in fixed investment. But it is also more volatile, with Q4 down 3.7%.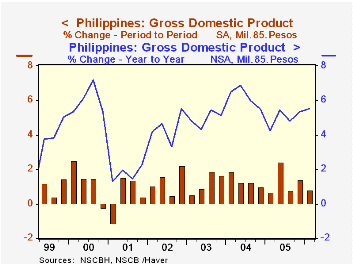
In the Philippines, quarterly movements in individual sectors are frequently uneven. In Q1, total GDP slowed to 0.8% from 1.4% growth in Q4. Agriculture, mining, manufacturing, trade and real estate contributed to the slowing, transportation and private services were steady to somewhat slower, but construction, finance and government picked up considerably. On the demand side, total domestic demand accelerated to 1.4% growth from -0.1% in Q4; net exports also added to growth through a much smaller deficit. But the statistical discrepancy turned sharply negative, so it is hard to identify the genuine demand-side source of the slower pace in total GDP. At the same time, gains in prior quarters meant, as noted above, that the overall economy still saw 5.3% year-on-year growth. See in the last graph how the lurches in quarter-to-quarter performance still produce the respectable yearly pace.
| GDP: % Changes* | Q1 2006 | Q4 2005 | Q3 2005 | Year/ Year | 2005 | 2004 | 2003 |
|---|---|---|---|---|---|---|---|
| India | 2.7 | 1.1 | 1.8 | 9.3 | 8.2 | 7.3 | 7.3 |
| Manufacturing | 3.4 | 2.6 | 1.5 | 8.9 | 8.8 | 8.0 | 7.1 |
| Trade, Hotels, Transport, Etc. | 4.4 | 2.1 | 2.5 | 12.9 | 10.9 | 11.4 | 10.9 |
| Finance, Business Services, Etc. | 1.3 | 1.7 | 3.1 | 10.8 | 9.7 | 7.8 | 4.9 |
| Malaysia | 2.2 | 1.1 | 1.7 | 5.3 | 5.2 | 7.2 | 5.5 |
| Philippines | 0.8 | 1.4 | 0.7 | 5.5 | 5.0 | 6.2 | 4.9 |
Tom Moeller
AuthorMore in Author Profile »Prior to joining Haver Analytics in 2000, Mr. Moeller worked as the Economist at Chancellor Capital Management from 1985 to 1999. There, he developed comprehensive economic forecasts and interpreted economic data for equity and fixed income portfolio managers. Also at Chancellor, Mr. Moeller worked as an equity analyst and was responsible for researching and rating companies in the economically sensitive automobile and housing industries for investment in Chancellor’s equity portfolio. Prior to joining Chancellor, Mr. Moeller was an Economist at Citibank from 1979 to 1984. He also analyzed pricing behavior in the metals industry for the Council on Wage and Price Stability in Washington, D.C. In 1999, Mr. Moeller received the award for most accurate forecast from the Forecasters' Club of New York. From 1990 to 1992 he was President of the New York Association for Business Economists. Mr. Moeller earned an M.B.A. in Finance from Fordham University, where he graduated in 1987. He holds a Bachelor of Arts in Economics from George Washington University.
More Economy in Brief
 Global| Feb 05 2026
Charts of the Week: Balanced Policy, Resilient Data and AI Narratives
by:Andrew Cates


