 Global| Jan 30 2003
4Q GDP Growth Weak
by:Tom Moeller
|in:Economy in Brief
Summary
Real GDP last quarter grew slightly less than expected. At 0.7% (AR) growth was the weakest since 3Q01. Consensus expectations were for 1.0% growth. A slower rate of inventory accumulation subtracted from GDP growth for the first [...]
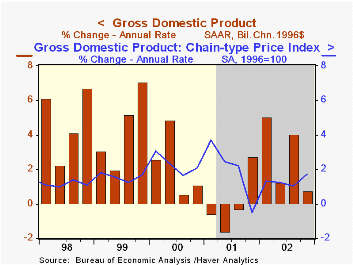
Real GDP last quarter grew slightly less than expected. At 0.7% (AR) growth was the weakest since 3Q01. Consensus expectations were for 1.0% growth.
A slower rate of inventory accumulation subtracted from GDP growth for the first quarter since last year. In the first three quarters of 2002, businesses were increasing production to either slow the rate of inventory decumulation or shift to inventory accumulation. On average that increase added 1.2% percentage points to GDP growth. Production in 4Q fell.
Domestic final demand grew a subpar 1.3% last quarter led by the weakest growth in personal consumption expenditures (1.0%) in ten years. Spending on motor vehicles and parts fell for the third quarter in four and growth in services PCE was the weakest since 3Q01.
Capital spending rose 1.5%, the first quarterly increase since 3Q00. Business spending on structures fell for the seventh quarter in eight (-15.5% y/y). Spending on equipment and software rose 5.0%. Spending on information processing equipment & software rose for the fourth straight quarter, up 9.2% y/y. The Federal Reserve Bank of St. Louis discusses the impact of Y2K on capital spending here .
Residential investment grew 6.9% (6.1% y/y), the strongest growth since 1Q02.
The trade sector's contribution to growth was quite negative following little contribution in 3Q. Exports fell 1.7% (5.0% y/y) for the first decline of the year. Imports grew 3.7% (9.2% y/y).
Inflation was the strongest since 1Q02.
| Chained '96 $, % AR | 4Q'02 (Advance) | 3Q'02 (Final) | Y/Y | 2002 | 2001 | 2000 |
|---|---|---|---|---|---|---|
| GDP | 0.7% | 4.0% | 2.8% | 2.4% | 0.3% | 3.8% |
| Inventory Effect | -0.6% | 0.6% | 1.0% | 0.6% | -1.2% | 0.1% |
| Final Sales | 1.3% | 3.4% | 1.8% | 1.8% | 1.5% | 3.7% |
| Trade Effect | -0.7% | -0.0% | -0.6% | -0.5% | -0.1% | -0.6% |
| Domestic Final Demand | 1.9% | 3.3% | 2.4% | 2.3% | 1.6% | 4.3% |
| Chained GDP Price Deflator | 1.7% | 1.0% | 1.3% | 1.1% | 2.4% | 2.1% |
by Tom Moeller January 30, 2003
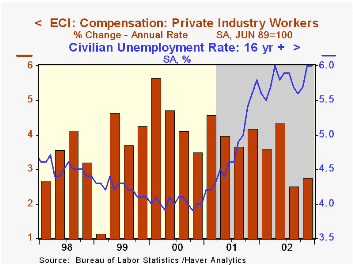
The employment cost index rose less than Consensus expectations for a 0.9% gain. The gain was only slightly stronger than in 3Q. The two increases are the slowest since 1Q 1999.
The gain in wages & salaries was the same as in 3Q and together they are the slowest since 1Q99. The gain in benefit costs picked up a bit but the y/y gain was the slowest in three years.
Compensation gains in white collar occupations was quite slow at 0.4% (3.2% y/y). Compensation in blue collar occupations also was the slowest in a year at 0.6% (3.6% y/y).
| ECI- Private Industry Workers | 4Q'02 | 3Q'02 | Y/Y | 2002 | 2001 | 2000 |
|---|---|---|---|---|---|---|
| Compensation | 0.7% | 0.6% | 3.2% | 3.2% | 4.2% | 4.4% |
| Wages & Salaries | 0.4% | 0.4% | 2.7% | 2.7% | 3.8% | 3.9% |
| Benefit Costs | 1.2% | 1.0% | 4.7% | 4.7% | 5.1% | 5.6% |
by Tom Moeller January 30, 2003
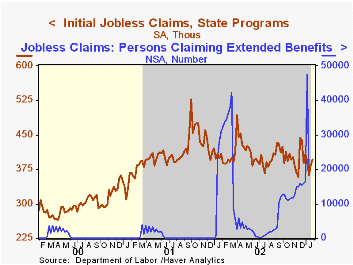
Initial claims for unemployment insurance rose more than expected last week. Claims rose 3.7% from the prior week's level which was revised up slightly.
The four-week moving average of initial claims fell to 384,000 (-4.8% y/y), the lowest level since late November.
Continuing claims for unemployment insurance fell 1.7% and the prior week's level was revised down.
The insured rate of unemployment was stable at 2.6%. The prior week's level was revised down.
| Unemployment Insurance (000s) | 1/25/03 | 1/18/03 | Y/Y | 2002 | 2001 | 2000 |
|---|---|---|---|---|---|---|
| Initial Claims | 397.0 | 383.0 | -2.7% | 405.0 | 405.8 | 299.8 |
| Continuing Claims | -- | 3,289 | -6.5% | 3,588 | 3,021 | 2,114 |
by Tom Moeller January 30, 2003
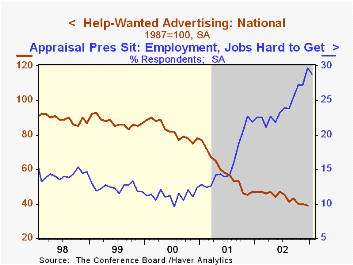
The Conference Board's National Index of Help-Wanted Advertising fell in December to the lowest level since late 1963.
The proportion of labor markets with rising want-ad volume improved for the second month to 47% from a downwardly revised 43% in November.
In a separate Conference Board survey, only 12.3% of respondents viewed jobs as plentiful in December. That figure rose to a still low 14.5% in January.
Jobs were viewed as hard to get by 29.7% of respondents in December, a figure that fell to 28.8% in January.
During the last ten years there has been a 67% correlation between the level of help-wanted advertising and the monthly change in nonfarm payrolls. The correlation with the y/y change in employment has been 92%.
All of the figures mentioned above are seasonally adjusted.
| Conference Board | Dec02 | Nov02 | Dec '01 |
|---|---|---|---|
| National Help Wanted Index | 39 | 40 | 47 |

Tom Moeller
AuthorMore in Author Profile »Prior to joining Haver Analytics in 2000, Mr. Moeller worked as the Economist at Chancellor Capital Management from 1985 to 1999. There, he developed comprehensive economic forecasts and interpreted economic data for equity and fixed income portfolio managers. Also at Chancellor, Mr. Moeller worked as an equity analyst and was responsible for researching and rating companies in the economically sensitive automobile and housing industries for investment in Chancellor’s equity portfolio. Prior to joining Chancellor, Mr. Moeller was an Economist at Citibank from 1979 to 1984. He also analyzed pricing behavior in the metals industry for the Council on Wage and Price Stability in Washington, D.C. In 1999, Mr. Moeller received the award for most accurate forecast from the Forecasters' Club of New York. From 1990 to 1992 he was President of the New York Association for Business Economists. Mr. Moeller earned an M.B.A. in Finance from Fordham University, where he graduated in 1987. He holds a Bachelor of Arts in Economics from George Washington University.


