 Global| Nov 05 2009
3Q U.S. Worker Productivity Surges-- Strongest Since 2003
by:Tom Moeller
|in:Economy in Brief
Summary
The U.S. labor market is clearly signaling that the recession is over. The magnitude of the 9.5% jump in nonfarm worker productivity during 3Q'09 wasn't unprecedented for this early in a recovery. Its size is noteworthy because the [...]
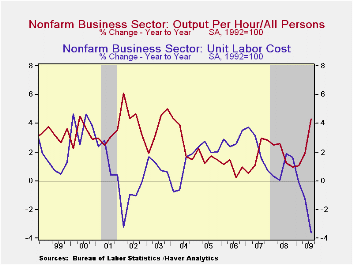
The U.S. labor market is clearly signaling that the recession is over. The magnitude of the 9.5% jump in nonfarm worker productivity during 3Q'09 wasn't unprecedented for this early in a recovery. Its size is noteworthy because the rise in output was moderate. The 3Q gain in productivity followed a similarly firm 6.9% 2Q rise which was little-revised. It was the strongest since 3Q'03 and outpaced Consensus expectations for a 6.4% increase.
 The gain in productivity occurred as output posted its first
increase in over a year. The moderate 4.0% rise was accompanied by a
continuation of the sharp decline in hours-worked (employment times
hours), which has been so much a part of this recession. The 5.0%
(-7.5% y/y) decline in hours-worked followed a 7.5% 2Q drop.
The gain in productivity occurred as output posted its first
increase in over a year. The moderate 4.0% rise was accompanied by a
continuation of the sharp decline in hours-worked (employment times
hours), which has been so much a part of this recession. The 5.0%
(-7.5% y/y) decline in hours-worked followed a 7.5% 2Q drop.
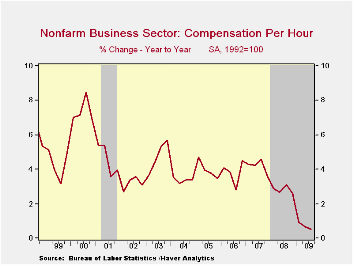
Compensation costs, however, improved with the gain in output per hour. The 3.8% quarterly increase was the first gain in a year though it left costs up just 0.5% y/y. That gain was nearly the weakest since 1949.
 The surge in productivity combined with a moderate increase in
compensation combined to further drop unit labor costs. The 5.2% q/q
decline was the third consecutive quarterly fall and it lowered the y/y
change to -3.6%, the sharpest since early-1950.
The surge in productivity combined with a moderate increase in
compensation combined to further drop unit labor costs. The 5.2% q/q
decline was the third consecutive quarterly fall and it lowered the y/y
change to -3.6%, the sharpest since early-1950.
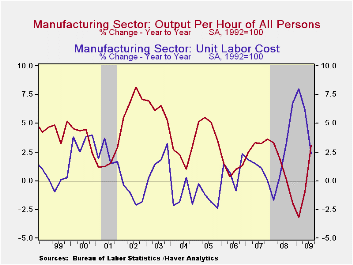
Surging worker productivity growth in the factory sector led the overall gain in output-per-hour. The 13.6% (AR) quarterly increase was a record and it lifted y/y growth to 3.1%, the highest since early last year. The increase came as output rose at a 7.7% rate (-10.8% y/y) and hours worked fell at a 5.2% rate (-13.5% y/y). Compensation rose 5.5% (5.5% y/y), therefore unit labor costs in the factory sector fell at a 7.1% annual rate (+2.3% y/y).
The productivity & cost figures are available in Haver's USECON database.
| Nonfarm Business Sector (SAAR, %) | 3Q '09 | 2Q '09 | 1Q '08 | Y/Y | 2008 | 2007 | 2006 |
|---|---|---|---|---|---|---|---|
| Output per Hour | 9.5 | 6.9 | 0.3 | 4.3 | 1.8 | 1.9 | 0.9 |
| Compensation per Hour | 3.8 | 0.3 | -4.7 | 0.5 | 2.8 | 4.2 | 3.8 |
| Unit Labor Costs | -5.2 | -6.1 | -5.0 | -3.6 | 1.0 | 2.3 | 2.8 |
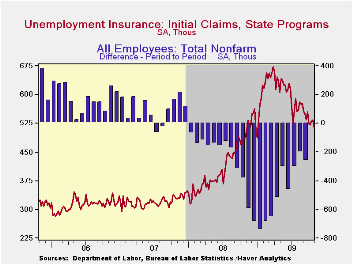
U.S. Weekly Initial Claims For Unemployment Insurance Lowest Since January
by Tom Moeller November 5, 2009
 The Labor
Department indicated that initial claims for unemployment insurance
fell moderately to 512,000 last week from a little-revised 532,000. The
latest figure represented material labor market improvement since it
was the lowest since the first week of January. Moreover, claims have
fallen sharply from the peak reached in March of 674,000 claims. The
four-week moving average of claims fell to 523,750 and the latest
weekly figure was lower than Consensus expectations for 520,000
claims.
The Labor
Department indicated that initial claims for unemployment insurance
fell moderately to 512,000 last week from a little-revised 532,000. The
latest figure represented material labor market improvement since it
was the lowest since the first week of January. Moreover, claims have
fallen sharply from the peak reached in March of 674,000 claims. The
four-week moving average of claims fell to 523,750 and the latest
weekly figure was lower than Consensus expectations for 520,000
claims.
 Continuing
claims for unemployment insurance during the latest
week fell 68,000 to their lowest level since late-March. The decline
reflects the improved job market but may also be a function of the
exhaustion of benefits. Continuing claims provide an indication of
workers' ability to find employment. The four-week average of
continuing claims fell modestly to 5,886,250 and have fallen 13.0% from
their peak. This series dates back to
1966.
Continuing
claims for unemployment insurance during the latest
week fell 68,000 to their lowest level since late-March. The decline
reflects the improved job market but may also be a function of the
exhaustion of benefits. Continuing claims provide an indication of
workers' ability to find employment. The four-week average of
continuing claims fell modestly to 5,886,250 and have fallen 13.0% from
their peak. This series dates back to
1966.
Extended benefits for unemployment insurance rose moderately and reversed half of the prior week's decline. Through early-October extended benefits averaged 551,355.
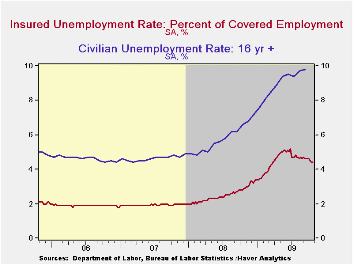
 The
insured rate of
unemployment held steady at 4.4% and matched its lowest since
late-March. The rate reached a high of 5.2% during late-June. During
the last ten years, there has been a 93% correlation between the level
of the insured unemployment rate and the overall rate of unemployment
published by the Bureau of Labor Statistics.
The
insured rate of
unemployment held steady at 4.4% and matched its lowest since
late-March. The rate reached a high of 5.2% during late-June. During
the last ten years, there has been a 93% correlation between the level
of the insured unemployment rate and the overall rate of unemployment
published by the Bureau of Labor Statistics.
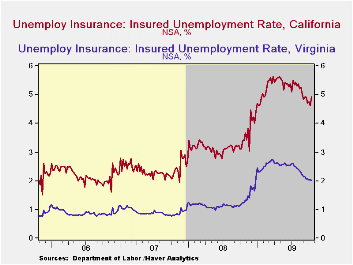
The highest insured unemployment rates in the week ending October 17 were in Puerto Rico (6.4%), Nevada (5.4), Oregon (5.4), California (4.9), Pennsylvania (4.9), Arkansas (4.8), Wisconsin (4.8), Michigan (4.7), Alaska (4.6), North Carolina (4.6), and South Carolina (4.6). The lowest insured unemployment rates were in North Dakota (1.0%), South Dakota (1.1), Virginia (2.0), Wyoming (2.8), Maine (2.5), Texas (2.5), Colorado (3.0), Maryland (3.0), Mississippi (3.6), New York (3.5), Florida (3.7), and Georgia (3.8).
The unemployment insurance claims data is available in Haver's WEEKLY database and the state data is in the REGIONW database.
Asia Recovering Rapidly, but Faces Challenges, says IMF from the International Monetary Fund can be found here
| Unemployment Insurance (000s) | 10/30/09 | 10/23/09 | 10/16/09 | Y/Y | 2008 | 2007 | 2006 |
|---|---|---|---|---|---|---|---|
| Initial Claims | 512 | 532 | 531 | 4.9% | 420 | 321 | 313 |
| Continuing Claims | -- | 5,749 | 5,817 | 49.0% | 3,342 | 2,552 | 2,459 |
| Insured Unemployment Rate (%) | -- | 4.4 | 4.4 | 2.8 (10/2008) | 2.5 | 1.9 | 1.9 |
Retail Sales Continue to Sag as Auto Registrations See Stimulus
by Robert Brusca November 5, 2009
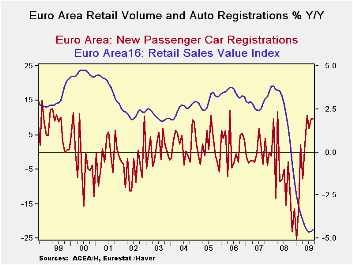
Retail sales fell again in September in the e-Zone. Retail
sales and vehicle registrations are on nearly opposite paths. Sales are
still falling while vehicle registrations bolstered by an assortment of
government programs have been spurred higher. All this stirs the pot of
controversy since in the EU Commission indices that describe the
various EMU sectors, consumer confidence and retailing tend to show the
highest relative scores. Based on the EU surveys it would seem that
consumer attitudes and retailing are leading EMU ahead, yet in terms of
the hard data on spending that matter most that does not seem to be
true.
Partly this divergence is a question of looking at levels of
Vs changes. The levels of satisfaction assessed for the consumer and
retailing sector surveys by the EU Commission are high relative to
other sectors (though still low in absolute terms). For MFG and even
services the relative levels of the indices compared to normal times
are extremely low, but theses sectors had fallen hard in recession and
are now rising, or rising strongly as is the case with MFG and despite
their low ratings they are boosting growth the most.
So far European recovery seems to have come on the back of the
industrial sector with rising output and orders but from an extremely
low level. But with the euro currency also rising in value Vs other
currencies, much of this demand seems to have been foreign-sourced thus
questioning how far Europe can go without participation from its own
consumers. The string of declines in retail sales raises that question
again. It may be that the auto incentive schemes have diverted some
spending from retail sales. But the European recovery cannot be based
simply on selling autos and exporting. We continue to look for life in
retailing to give optimism to the view of a sustained euro-recovery.
| Euro Area Retail Sales | ||||||
|---|---|---|---|---|---|---|
| M/M | SAAR | |||||
| Sep-09 | Aug-09 | Jul-09 | 3-Mo | 6-Mo | 12-Mo | |
| Zone Total Value | -0.3% | -0.2% | -0.2% | -3.0% | -3.3% | -4.6% |
| Food,Beverages,Tobacco | -0.1% | -0.1% | -0.2% | -1.8% | -2.1% | -2.1% |
| Registrations: | ||||||
| Motor Vehicle Registration | 6.7% | -6.8% | 0.2% | -1.5% | 33.3% | 9.7% |
| Nonfood Country detail: Volume | ||||||
| Germany Value | -0.5% | -1.8% | 1.5% | -3.4% | -3.9% | -4.0% |
| UK (EU) Volume | 0.0% | 0.1% | 0.3% | 1.4% | 3.3% | 2.4% |
| The EA 13 countries are Austria, Belgium, Finland, France, Germany, Greece, Ireland, Italy, Luxembourg, the Netherlands, Portugal, Slovenia. | ||||||

Tom Moeller
AuthorMore in Author Profile »Prior to joining Haver Analytics in 2000, Mr. Moeller worked as the Economist at Chancellor Capital Management from 1985 to 1999. There, he developed comprehensive economic forecasts and interpreted economic data for equity and fixed income portfolio managers. Also at Chancellor, Mr. Moeller worked as an equity analyst and was responsible for researching and rating companies in the economically sensitive automobile and housing industries for investment in Chancellor’s equity portfolio. Prior to joining Chancellor, Mr. Moeller was an Economist at Citibank from 1979 to 1984. He also analyzed pricing behavior in the metals industry for the Council on Wage and Price Stability in Washington, D.C. In 1999, Mr. Moeller received the award for most accurate forecast from the Forecasters' Club of New York. From 1990 to 1992 he was President of the New York Association for Business Economists. Mr. Moeller earned an M.B.A. in Finance from Fordham University, where he graduated in 1987. He holds a Bachelor of Arts in Economics from George Washington University.
More Economy in Brief


