 Global| Sep 07 2005
2Q U.S. Productivity Revised Down
by:Tom Moeller
|in:Economy in Brief
Summary
Non-farm labor productivity last quarter was revised down to 1.8% from 2.2%. Consensus expectations had been for 2.1% growth. Growth in output was lowered to 4.1% from 4.4% reported initially while hours worked were raised to 2.2% [...]
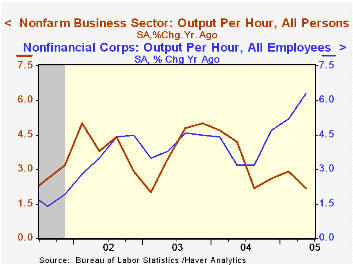
Non-farm labor productivity last quarter was revised down to 1.8% from 2.2%. Consensus expectations had been for 2.1% growth. Growth in output was lowered to 4.1% from 4.4% reported initially while hours worked were raised to 2.2% from 2.1%.
Unit labor cost growth was revised sharply higher to 2.5% from 1.3% reflecting the reduction in productivity, but compensation costs were raised even more to 4.4% from 3.5%.
Factory sector productivity growth was similarly reduced to 3.6% (4.6% y/y) from 4.1% due to a lowered estimate of output.An upward revision to manufacturing compensation growth to 8.4% from 6.6% raised unit Labor costs sharply to 4.7% (4.3% y/y) from 2.3%.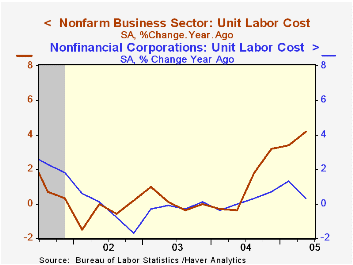
Reported for the first time, nonfinancial corporate sector productivity surged 6.8% (6.3% y/y) and the spike lowered unit labor costs by 2.6% (+0.3% y/y). Output rose 9.5% (8.0% y/y). This measure is gleaned from the income side of the National Income & Product Accounts (NIPA) as opposed to the non-farm and manufacturing figures which are derived from the output side.
Analysis of the Economic & Budgetary Effects of Hurricane Katrina from the US Congressional Budget Office can be found here.
| Non-farm Business Sector (SAAR) | 2Q '05 (Revised) | 2Q '05 (Prelim.) | 1Q '05 | Y/Y | 2004 | 2003 | 2002 |
|---|---|---|---|---|---|---|---|
| Output per Hour | 1.8% | 2.2% | 3.2% | 2.2% | 3.4% | 3.8% | 4.0% |
| Compensation | 4.4% | 3.5% | 5.5% | 6.5% | 4.5% | 4.0% | 3.5% |
| Unit Labor Costs | 2.5% | 1.3% | 2.2% | 4.2% | 1.1% | 0.2% | -0.5% |
by Tom Moeller September 7, 2005
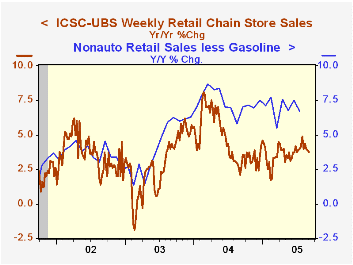
The International Council of Shopping Centers (ICSC)-UBS survey indicated that chain store sales were flat last week following four successive weeks of decline during August.
The ICSC indicated that "The results for this past week reflect the fallout of Hurricane Katrina as national sales were held back by about one percentage point as stores were closed in the path of the hurricane.”
During the last ten years there has been a 56% correlation between the y/y change in chain store sales and the change in non-auto retail sales less gasoline, as published by the US Census Department. Chain store sales correspond directly with roughly 14% of non-auto retail sales less gasoline. The leading indicator of chain store sales from ICSC fell in the latest week by 0.1% (+0.2% y/y) following a 0.2% decline the week prior.The ICSC-UBS retail chain-store sales index is constructed using the same-store sales (stores open for one year) reported by 78 stores of seven retailers: Dayton Hudson, Federated, Kmart, May, J.C. Penney, Sears and Wal-Mart.
| ICSC-UBS (SA, 1977=100) | 09/03/05 | 08/27/05 | Y/Y | 2004 | 2003 |
|---|---|---|---|---|---|
| Total Weekly Chain Store Sales | 455.4 | 455.5 | 3.8% | 4.6% | 2.9% |
by Tom Moeller September 7, 2005
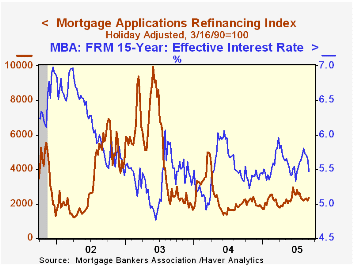
The total number of mortgage applications jumped 6.8% last week and recovered to the highest level since late July, according to the Mortgage Bankers Association.
Mortgage applications to refinance surged 7.7% w/w to the highest level since July as the effective interest rate on a conventional 30-year mortgage fell further to 5.87% from 5.98% the prior week. The effective rate on a 15-year mortgage also fell to 5.47%.
Purchase applications surged 6.1% after two weeks of sharp decline but the average level in August fell 1.3% from July. During the last ten years there has been a 49% correlation between the y/y change in purchase applications and the change in new plus existing single family home sales.
The Mortgage Bankers Association surveys between 20 to 35 of the top lenders in the U.S. housing industry to derive its refinance, purchase and market indexes. The weekly survey accounts for more than 40% of all applications processed each week by mortgage lenders. Visit the Mortgage Bankers Association site here.
| MBA Mortgage Applications (3/16/90=100) | 09/02/05 | 08/26/05 | Y/Y | 2004 | 2003 | 2002 |
|---|---|---|---|---|---|---|
| Total Market Index | 771.6 | 722.5 | 11.5% | 735.1 | 1,067.9 | 799.7 |
| Purchase | 499.1 | 470.6 | 4.9% | 454.5 | 395.1 | 354.7 |
| Refinancing | 2,357.1 | 2,187.8 | 20.9% | 2,366.8 | 4,981.8 | 3,388.0 |
by Carol Stone September 7, 2005
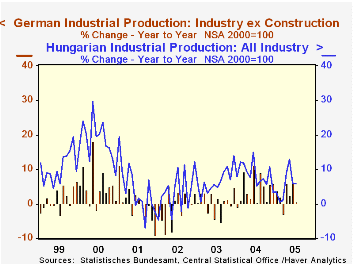
Industrial production in Europe appears to be holding up well, according to data for four countries reported today for July. Month-to-month movements are a bit erratic, but trends are distinctly upward, nonetheless.
As Louise Curley explained here yesterday, Germany's manufacturing sector is growing, at least for the present. Her commentary on factory sales data cited their 3.8% gain in July. The production behind those sales was up 1.3%, with total industrial output (excluding construction) up 1.1%. This was the second marked increase in a row after a sluggish performance in the winter and spring. The July gains were widespread across individual industries, with only petroleum refining, machinery and electrical equipment experiencing declines; that in machinery followed spike in June.
In Norway, total industrial production was up 1.1% in July after a drop of 6.2% in June. Oil and gas extraction dominates Norwegian industry; that sector rose after two sharp declines, and has been on an extended downtrend. By contrast, Norway's factories saw a small downtick in July, but prior increases have pushed their year-on-year performance to 4.0% growth, a pick-up after a small increase in 2004 and annual declines running all the way back through 1999. 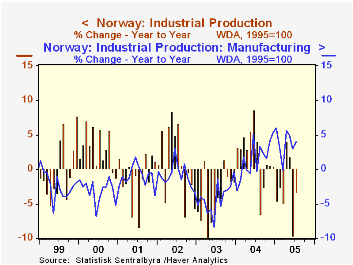
In Hungary and Slovakia, modest increases in July followed declines in June, but year-on-year gains are substantial, at 5.8% and 4.7%, respectively. These countries' industrial sectors have been expanding vigorously for at least the last four years, and the gains in Hungary for one version of its index go back to 1993.
Thus, as we indicated at the beginning, European industry seems stronger than might have perhaps been expected, given the high level of the euro and the high level of energy prices. However, this latter factor in particular may yet become burdensome for these nations. Louise Curley also pointed out here yesterday that domestic new orders in Germany have already turned flat. So it remains to be seen how long the recent gains in European production can be sustained.
| Industrial Production* | July 2005 | June 2005 | Year/Year | 2004 | 2003 | 2002 |
|---|---|---|---|---|---|---|
| Germany | 1.1 | 1.4 | 0.6 | 3.0 | 0.4 | -1.0 |
| Norway | 1.1 | -6.2 | -3.4 | 2.0 | -4.1 | 0.9 |
| Oil & Gas Extraction | 1.2 | -9.5 | -5.7 | -1.5 | -1.7 | -1.5 |
| Manufacturing | -0.1 | 1.1 | 4.0 | 1.5 | -4.3 | -0.9 |
| Hungary | 1.2 | -1.6 | 5.8 | 8.4 | 6.6 | 3.3 |
| Slovakia | 0.2 | -0.5 | 4.7 | 4.2 | 5.0 | 6.4 |

Tom Moeller
AuthorMore in Author Profile »Prior to joining Haver Analytics in 2000, Mr. Moeller worked as the Economist at Chancellor Capital Management from 1985 to 1999. There, he developed comprehensive economic forecasts and interpreted economic data for equity and fixed income portfolio managers. Also at Chancellor, Mr. Moeller worked as an equity analyst and was responsible for researching and rating companies in the economically sensitive automobile and housing industries for investment in Chancellor’s equity portfolio. Prior to joining Chancellor, Mr. Moeller was an Economist at Citibank from 1979 to 1984. He also analyzed pricing behavior in the metals industry for the Council on Wage and Price Stability in Washington, D.C. In 1999, Mr. Moeller received the award for most accurate forecast from the Forecasters' Club of New York. From 1990 to 1992 he was President of the New York Association for Business Economists. Mr. Moeller earned an M.B.A. in Finance from Fordham University, where he graduated in 1987. He holds a Bachelor of Arts in Economics from George Washington University.
More Economy in Brief


