 Global| May 25 2006
1Q US GDP Growth Revised Up, Profits Soared
by:Tom Moeller
|in:Economy in Brief
Summary
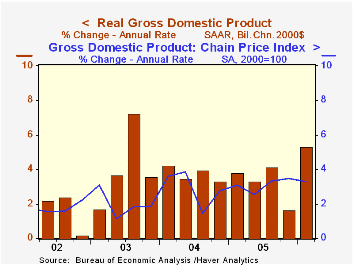
During 1Q06 the U.S. economy grew 5.3% (AR), faster than the initially estimated 4.8% which was an acceleration from 1.7% during 4Q05. The increase fell short of Consensus expectations for a revision to 5.8% and growth of 3.0-3.5% is [...]
Inventories subtracted a lesser 0.1% from GDP growth during 1Q versus the initial estimate of a 0.5% subtraction.
The 0.6 percentage point subtraction from a wider foreign trade deficit also was less than the initially estimated 0.8 percentage points. Growth in exports was revised up to 14.7% (8.1% y/y) and import growth of 12.8% (6.6% y/y) was little changed.
Domestic demand growth was lessened to 5.7% from 5.9% estimated initially due to lowered estimates of growth in personal consumption and business investment.
Growth in personal consumption expenditures was revised down to 5.2% (3.4% y/y) from 5.5%. The estimate of growth in spending on services was reduced to 2.2% (2.6% y/y) from 2.8% while estimates of strong spending in most goods categories were little changed.
Growth in business fixed investment also was reduced to a still strong 13.8% (10.0% y/y) from 17.9% estimated last month. Growth in spending on structures was halved to 11.4% (4.8% y/y). Residential investment grew 3.0% (5.9% y/y).
The estimate of the GDP chain price index was unchanged at 3.3%.
| Chained 2000$, % AR | 1Q '06 (Prelim.) | 1Q '06 (Advance) | 4Q '05 | Y/Y | 2005 | 2004 | 2003 |
|---|---|---|---|---|---|---|---|
| GDP | 5.3% | 4.8% | 1.7% | 3.6% | 3.5% | 4.2% | 2.7% |
| Inventory Effect | -0.1% | -0.5% | 1.9% | -0.2% | -0.3% | 0.3% | 0.0% |
| Final Sales | 5.5% | 5.4% | -0.2% | 3.8% | 3.8% | 3.9% | 2.7% |
| Foreign Trade Effect | -0.6% | -0.8% | -1.4% | 0.0% | -0.1% | -0.5% | -0.3% |
| Domestic Final Demand | 5.7% | 5.9% | 1.1% | 3.8% | 3.9% | 4.4% | 3.0% |
| Chained GDP Price Index | 3.3% | 3.3% | 3.5% | 3.2% | 2.8% | 2.6% | 2.0% |
by Tom Moeller May 25, 2006

The latest release from the National Association of Realtors is available here.
| Existing Home Sales (000, AR) | April | March | Y/Y | 2005 | 2004 | 2003 |
|---|---|---|---|---|---|---|
| Total Home Sales | 6,760 | 6,900 | -5.7% | 7,064 | 6,722 | 6,176 |
| Single Family Home Sales | 5,920 | 6,040 | -5.6% | 6,170 | 5,912 | 5,443 |
| Single Family Median Home Price (000) | $222.7 | $217.2 | 4.3% | $206.3 | $182.8 | $169.1 |
by Tom Moeller May 25, 2006

Last week, initial unemployment insurance claims fell 40,000 to 329,000 due to the resolution of a partial government shutdown in Puerto Rico. The drop reversed nearly all of the prior week's little revised rise. Consensus expectations had been for 315,000 claims.
The four week moving average of initial claims rose to 337,000 (0.9% y/y).
Continuing claims for unemployment insurance increased 38,000 following a revised 1,000 rise during the prior week.
The insured rate of unemployment ticked up to 1.9% following two weeks at 1.8%.
Financial literacy, testimony of Federal Reserve Board Chairman Ben S. Bernanke, can be found here.
| Unemployment Insurance (000s) | 05/20/06 | 05/13/06 | Y/Y | 2005 | 2004 | 2003 |
|---|---|---|---|---|---|---|
| Initial Claims | 329 | 369 | 0.6% | 332 | 343 | 403 |
| Continuing Claims | -- | 2,420 | -6.7% | 2,663 | 2,923 | 3,530 |
by Carol Stone May 25, 2006

New Zealand's trade balance improved in April, according to data reported this morning in Wellington by Statistics New Zealand. Markets and analysts focus on rolling 12-month totals for New Zealand, and the trade deficit on that basis narrowed to NZ$6.90 billion for the year ended April from NZ$7.05 billion in March. The April figure was the smallest deficit this year although much wider than the NZ$4.30 billion of April 2005.
As evident in both the graph and the table below, cumulative exports are little changed over the last year, but imports are up some 7.7%. Petroleum accounts for a big part of this: the value of those imports has increased by nearly 26%. The largest single import item is vehicles, and these purchases have actually decreased from a year ago, to NZ$5.15 billion from NZ$5.52 billion.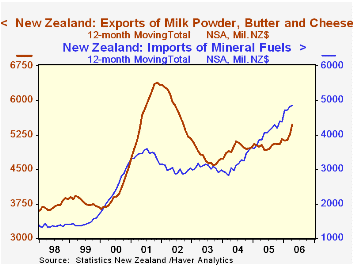
New Zealand is largely a service and agricultural economy. The trade balance improvement, which started in March, owes mainly to gains in dairy product exports: milk powder, butter and cheese. These had an aggregate total of NZ$5.48 billion in April compared with NZ$5.04 billion a year ago. Machinery, aluminum and beverage exports also rose.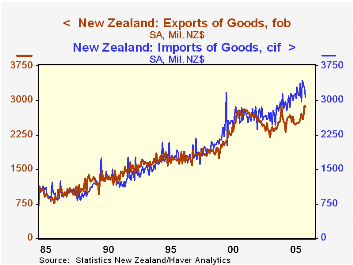
These data, all from Statistics New Zealand, are contained in Haver's ANZ database, along with our Australia data offerings. This database includes only series that come from the countries' own data sources. For some major countries that do not seasonally adjust certain data, Haver performs that procedure; these supplemental data are contained in the database G10. This latter collection includes key data summaries for 22 countries, the Euro-Zone and several regional groupings. For New Zealand, Haver's calculations show the trade deficit for the month of April alone was NZ$217 million, the smallest since NZ$173 million in January 2005. The reduction from March in the seasonally adjusted deficit from NZ$380 million consisted of a slim NZ$32 million decrease in exports and a more significant NZ$197 million drop in imports.
| New Zealand, NZ$ | Apr 2006 | Mar 2006 | Feb 2006 | Apr 2005 | 2005 | 2004 | 2003 |
|---|---|---|---|---|---|---|---|
| 12-Month Totals (Bil): Trade Balance | -6.90 | -7.05 | -7.32 | -4.30 | -6.46 | -4.20 | -3.38 |
| Exports | 31.33 | 31.10 | 30.71 | 31.20 | 30.82 | 30.71 | 28.40 |
| Imports | 38.22 | 38.16 | 38.03 | 35.50 | 37.27 | 34.91 | 31.78 |
| Individual Months, SA* (Mil): Trade Balance | -217 | -380 | -772 | -368 | Monthly Averages | ||
| -539 | -350 | -282 | |||||
| Exports | 2852 | 2886 | 2600 | 2643 | 2568 | 2560 | 2366 |
| Imports | 3069 | 3266 | 3372 | 3011 | 3107 | 2910 | 2648 |

Tom Moeller
AuthorMore in Author Profile »Prior to joining Haver Analytics in 2000, Mr. Moeller worked as the Economist at Chancellor Capital Management from 1985 to 1999. There, he developed comprehensive economic forecasts and interpreted economic data for equity and fixed income portfolio managers. Also at Chancellor, Mr. Moeller worked as an equity analyst and was responsible for researching and rating companies in the economically sensitive automobile and housing industries for investment in Chancellor’s equity portfolio. Prior to joining Chancellor, Mr. Moeller was an Economist at Citibank from 1979 to 1984. He also analyzed pricing behavior in the metals industry for the Council on Wage and Price Stability in Washington, D.C. In 1999, Mr. Moeller received the award for most accurate forecast from the Forecasters' Club of New York. From 1990 to 1992 he was President of the New York Association for Business Economists. Mr. Moeller earned an M.B.A. in Finance from Fordham University, where he graduated in 1987. He holds a Bachelor of Arts in Economics from George Washington University.
More Economy in Brief


