 Global| Apr 25 2003
1Q GDP Grew Modestly
by:Tom Moeller
|in:Economy in Brief
Summary
Real GDP last quarter grew 1.6% (AR), slightly less than Consensus expectations for 2.0% growth. Weakness in domestic demand was behind the only modest GDP growth. Final sales to domestic purchasers grew 1.2% and that was the weakest [...]
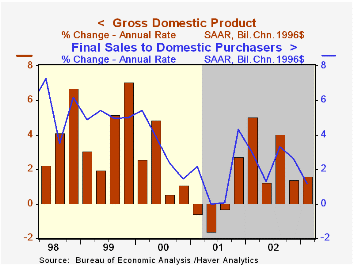
Real GDP last quarter grew 1.6% (AR), slightly less than Consensus expectations for 2.0% growth.
Weakness in domestic demand was behind the only modest GDP growth. Final sales to domestic purchasers grew 1.2% and that was the weakest since 3Q 2001. Personal consumption rose just 1.4% (2.3% y/y) as spending on motor vehicles fell for the fourth quarter in the last five. Spending on furniture and household equipment managed only a 3.3% (5.4% y/y) rise, the weakest quarterly gain since 3Q 1996.
Fixed business investment fell 4.2% (-1.3% y/y) due to declines in both structures and equipment & software. The drop in equipment spending was due to declines in the industrial, transportation and other categories. Spending on information processing rose for the fifth consecutive quarter.
Residential investment surged at a 12.0% (6.2% y/y) rate led by 17.7% growth in single family structures.
Government spending rose at only a 0.9% rate, held back by a 1.5% decline in defense outlays.
Inventories accumulated at only half the rate of 4Q02. The slowdown caused inventory accumulation to subtract 0.5 percentage points from GDP growth as production fell.
Improvement in the trade deficit added to GDP growth for the first quarter in two years. The add came as imports fell 7.9% (5.7% y/y). That decline outpaced the 3.2% (2.2% y/y) drop in exports, down for the second consecutive quarter.
Inflation rose at the fastest rate since 2Q 2001 led by a 2.8% gain in the personal consumption deflator. Residential investment prices also rose a strong 7.6%.
Analysis from the St. Louis Federal Reserve Bank titled "Identifying Business Cycle Turning Points in Real Time" can be found here.
| Chained '96 $, % AR | 1Q'03 | 4Q'02 | Y/Y | 2002 | 2001 | 2000 |
|---|---|---|---|---|---|---|
| GDP | 1.6% | 1.4% | 2.1% | 2.4% | 0.3% | 3.8% |
| Inventory Effect | -0.5% | 0.3% | 0.5% | 0.6% | -1.2% | 0.1% |
| Final Sales | 2.1% | 1.1% | 1.6% | 1.8% | 1.5% | 3.7% |
| Trade Effect | 0.9% | -1.6% | -0.5% | -0.5% | -0.1% | -0.6% |
| Domestic Final Demand | 1.2% | 2.6% | 2.1% | 2.4% | 1.6% | 4.3% |
| Chained GDP Price Deflator | 2.5% | 1.8% | 1.6% | 1.1% | 2.4% | 2.1% |
by Tom Moeller April 25, 2003
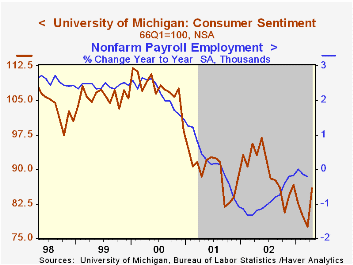
The April reading of Consumer Sentiment from the University of Michigan rose 10.8% versus March. The reading of 86.0 was firmer than Consensus expectations for 84.5, indicating that Sentiment improved as the month progressed.
The index of current conditions rose 7.1% after two months of decline. The index of expectations surged 13.9% and just about recouped all of the prior three months' decline.
Over the last five years there has been an 84% correlation between the level of consumer sentiment and the y/y change in payroll employment.
The University of Michigan survey is not seasonally adjusted.It is based on telephone interviews with 250 households nationwide on personal finances and business and buying conditions. The survey is expanded to a total of 500 interviews at month end.
| University of Michigan | April | Mar | Y/Y | 2002 | 2001 | 2000 |
|---|---|---|---|---|---|---|
| Consumer Sentiment | 86.0 | 77.6 | -7.5% | 89.6 | 89.2 | 107.6 |
by Tom Moeller April 25, 2003
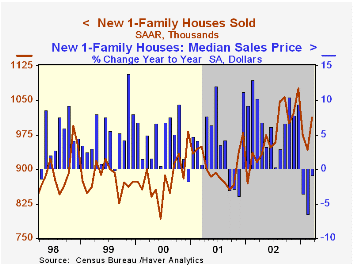
Sales of new single family homes rose much more than expected last month. Sales rose 7.3% from February's level which was revised higher. Consensus expectations were for a 910,000 sales rate in March.
Sales snapped back from a February level depressed by severe Winter weather. Sales rose 82.5% m/m in the Northeast region of the country after a 38.0% February decline.
Elsewhere in the country sales were mixed: down 26.4% (-10.1% y/y) in the Midwest; up 15.9% (18.1% y/y) in the South; about flat (-1.5% y/y) in the West for the third straight month.
The median price of a new home rose 1.8% to $182,000 (-0.8% y/y) and the prior month was revised down sharply.
The new home sales data reflect current sales versus the existing home sale figures which reflect closings on past sales.
| Homes Sales (000s, AR) | Mar | Feb | Y/Y | 2002 | 2001 | 2000 |
|---|---|---|---|---|---|---|
| New Single-Family | 1,012 | 943 | 10.6% | 978 | 908 | 880 |
by Tom Moeller April 25, 2003
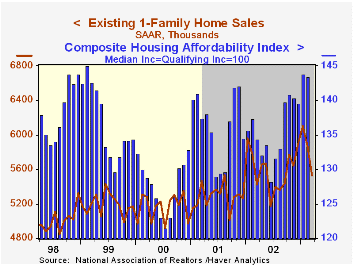
Sales of existing single family homes fell more than expected last month. The 5.6% m/m decline was the second consecutive monthly decline and probably continued to at least partially reflect severe Winter storms. Sales in February were revised up slightly.
Home sales fell in March in each of the country's regions.
The median price of an existing home rose 1.1% (m/m) in March to $163,100 (+6.5% y/y).
The figures reflect closings of past home sales.
| Existing Home Sales (000, AR) | Mar | Feb | Y/Y | 2002 | 2001 | 2000 |
|---|---|---|---|---|---|---|
| Existing Single-Family | 5,530 | 5,860 | 2.0% | 5,598 | 5,282 | 5,158 |

Tom Moeller
AuthorMore in Author Profile »Prior to joining Haver Analytics in 2000, Mr. Moeller worked as the Economist at Chancellor Capital Management from 1985 to 1999. There, he developed comprehensive economic forecasts and interpreted economic data for equity and fixed income portfolio managers. Also at Chancellor, Mr. Moeller worked as an equity analyst and was responsible for researching and rating companies in the economically sensitive automobile and housing industries for investment in Chancellor’s equity portfolio. Prior to joining Chancellor, Mr. Moeller was an Economist at Citibank from 1979 to 1984. He also analyzed pricing behavior in the metals industry for the Council on Wage and Price Stability in Washington, D.C. In 1999, Mr. Moeller received the award for most accurate forecast from the Forecasters' Club of New York. From 1990 to 1992 he was President of the New York Association for Business Economists. Mr. Moeller earned an M.B.A. in Finance from Fordham University, where he graduated in 1987. He holds a Bachelor of Arts in Economics from George Washington University.
More Economy in Brief


