Haver Analytics
Haver Analytics

Featured Data Additions: February 2026

  • GLSECTOR → Competitiveness Measures → Bellwether Company Statistics → Microsoft

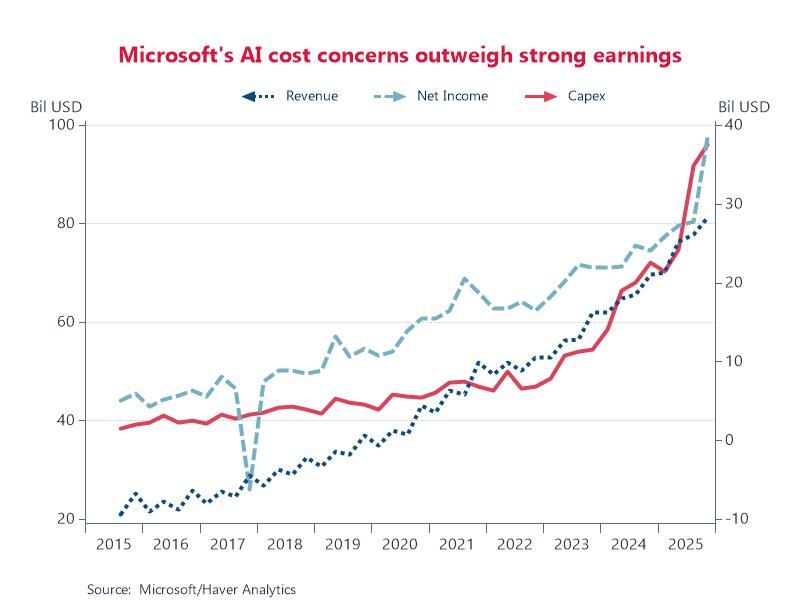
    Financial statistics for Microsoft were added to the bellwether company section of GLSECTOR. Key headline concepts for income, revenue, and capex are available. Quarterly data are sourced from MS’s SEC filings and start in Q3 2015.

    Chart: Microsoft’s latest report initially appeared to be a triumph, but over the next week, the stock price tumbled by 18%. Total revenue was reported at $81.3b, a 17% YoY increase, beating analyst estimates. However, the net income of $38.5b was bolstered by a one-time $7.6b accounting gain from the recapitalization of its stake in OpenAI, which is an accounting adjustment rather than an operational profit. The key issue was the rapidly rising capex, which reached $37.5b, representing a 66% YoY increase - much of it tied to AI infrastructure. The question for shareholders is whether the ROI can keep pace with the massive infrastructure bill.

  • SPAIN → Manufacturing, Trade and Services → E-Commerce Transactions or Business Volume

    E-commerce statistics for Spain were added to the SPAIN database. Number of transactions and sales reported in euros are available with detail by type of activity and region – for example, within Spain, from abroad with Spain, or from Spain to abroad. Quarterly data are sourced from Comision Nacional del los Mercados y la Competencia and start in Q4 2013.

    Chart: Spain’s e-commerce market posted double-digit QoQ growth in Q2 2025, reaching record sales of 28.3 billion euro, up 22.6% YoY. The number of transactions also climbed, by 16.8% YoY, to more than 493 million. 31.6% of the spending was domestic, between Spanish sellers and buyers, while the revenues of transactions originating in Spain that were sent to foreign locations accounted for 54.2% of the total, the vast majority to the EU.

  • CRYPTO → Decentralized Finance → Blockchain Distribution

    Stablecoin circulation by blockchain statistics were added to CRYPTO. Two hundred and fifty-four stablecoins are tracked across 158 blockchains giving you insights into the layout of the stablecoin ecosystem. These daily data are sourced from DeFiLlama and start as early as November 2017.

    Chart: Stablecoins circulate on multiple blockchains to enhance liquidity, increase utility across diverse decentralized applications, and to provide users with transaction speed and cost flexibility. $185 billion of USDT is circulating across 100 blockchains - 90% on Ethereum, Tron, and Solana. Ethereum acts as the primary network for institutional, high-value, and decentralized finance interactions. Tron is widely used for its cost-effective, high-volume transactions. Solana has emerged as a leading chain due to its high speed and low-cost transaction capabilities for everyday commerce.

  • EMERGECWRussia → Financial → Deposits and Funds of Legal Entities and Individuals

    Deposits and funds of legal entities and individuals statistics for Russia were added to EMERGECW. Both ruble- and foreign currency denominated deposits are available for organizations, legal entities, individuals and entrepreneurs. Monthly data are sourced from the Central Bank of Russia and start in January 2012.

    Chart: Russians have amassed a record amount of bank deposits as they take advantage of historically high interest rates in the wartime economy. Upon the invasion of Ukraine in 2022, panicked depositors rushed to withdraw cash. The central bank moved quickly to hike its key interest rate to 20% in an emergency step to stem the outflow. Rates were hiked again starting in 2023 to curb accelerating inflation. The extended period of high interest rates has made ruble deposits one of the most profitable investments in the country and has led to a doubling of deposits since 2022.