 Global| Feb 18 2026
Featured Data Additions, February 18, 2026
SPAIN → Manufacturing, Trade and Services → E-Commerce Transactions or Business Volume
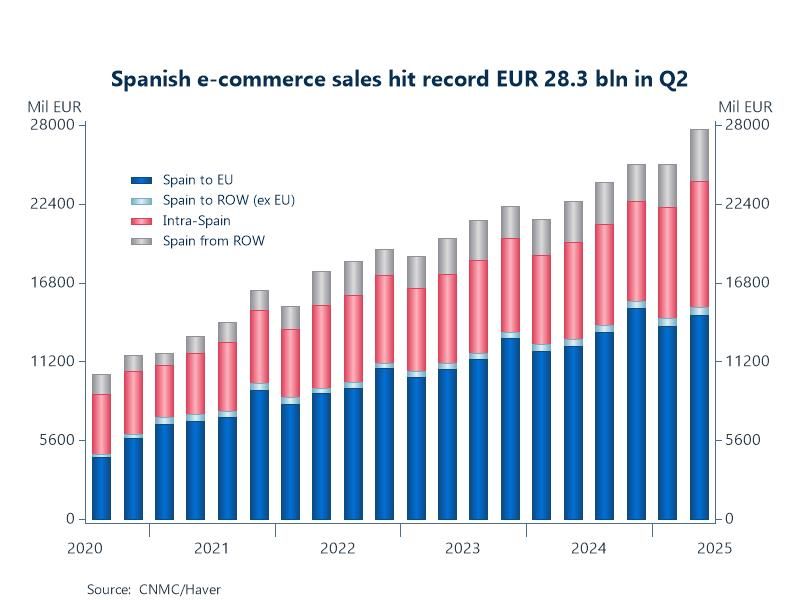
E-commerce statistics for Spain were added to the SPAIN database. Number of transactions and sales reported in euros are available with detail by type of activity and region – for example, within Spain, from abroad with Spain, or from Spain to abroad. Quarterly data are sourced from Comision Nacional del los Mercados y la Competencia and start in Q4 2013.
Chart: Spain’s e-commerce market posted double-digit QoQ growth in Q2 2025, reaching record sales of 28.3 billion euro, up 22.6% YoY. The number of transactions also climbed, by 16.8% YoY, to more than 493 million. 31.6% of the spending was domestic, between Spanish sellers and buyers, while the revenues of transactions originating in Spain that were sent to foreign locations accounted for 54.2% of the total, the vast majority to the EU.
GLSECTOR → Human Health → Weekly Influenza Report (World Health Organization)
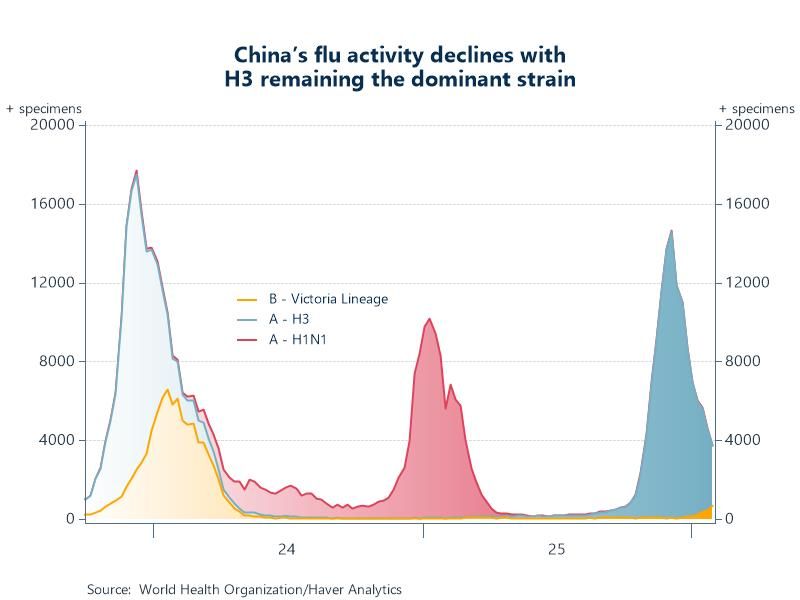
Global influenza statistics were added to the GLSECTOR database. 180 countries are covered in this data set. Concepts include specimens collected & processed and numbers of positive & negative specimens. Detail for positive specimens is available by type, subtype and lineages. Weekly data are sourced from the World Health Organization and start as early as 1995.
Chart: China saw flu cases increase by 86% and 52% YoY in November and December, respectively. However, its flu activity has been declining over the past two months and currently sits at a relatively low level. The H3 subtype of influenza A remains the dominant strain, averaging 97% of circulating strains over the past three months, while the proportion of the Victoria lineage of influenza B has been rising slowly.
DAILY→ Business Cycle Indicators and Surveys → BIS Daily Macroeconomic Sentiment via LLMs
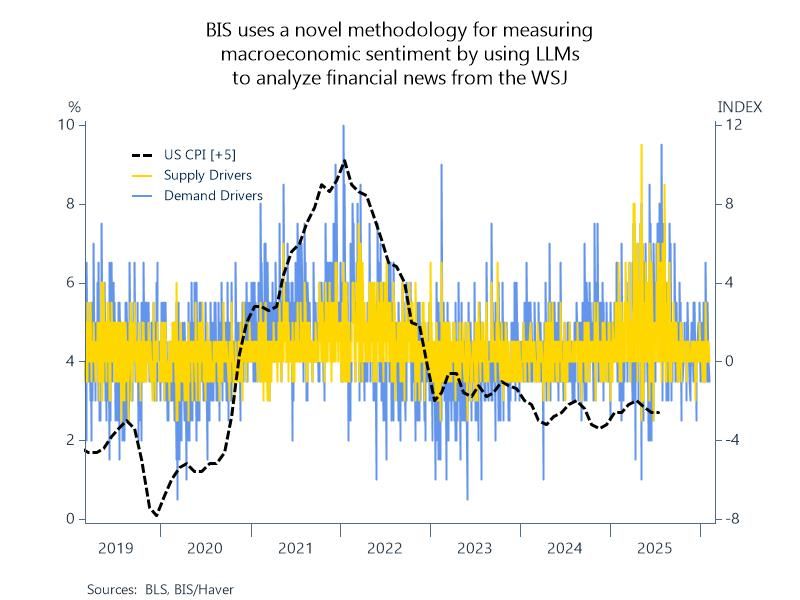
Macroeconomic sentiment indexes derived from large language models were added to the DAILY database. Indexes are available for economic growth and inflation – each containing demand and supply drivers with subcomponents for each – allowing for real-time economic surveillance and policymaking. Daily data are sourced from the BIS and start in January 2000.
Chart: The sentiment indexes typically lead the hard data – e.g. in 2021, it lead actual CPI by ~5 months. It also immediately picked up the 2025 tariff impact showing a sharp spike in inflation sentiment right after the policy was announced. If we look at the drivers, the post-pandemic shock was unique because both supply and demand were pushing inflation up at the same time. Supply chain disruptions on the supply side plus massive government stimulus on the demand side. In 2025, government tariff policy – a supply driver - was the main culprit for the increase in inflation sentiment.
EMERGEMA → Saudi Arabia → Housing and Construction → Construction Cost Indexes
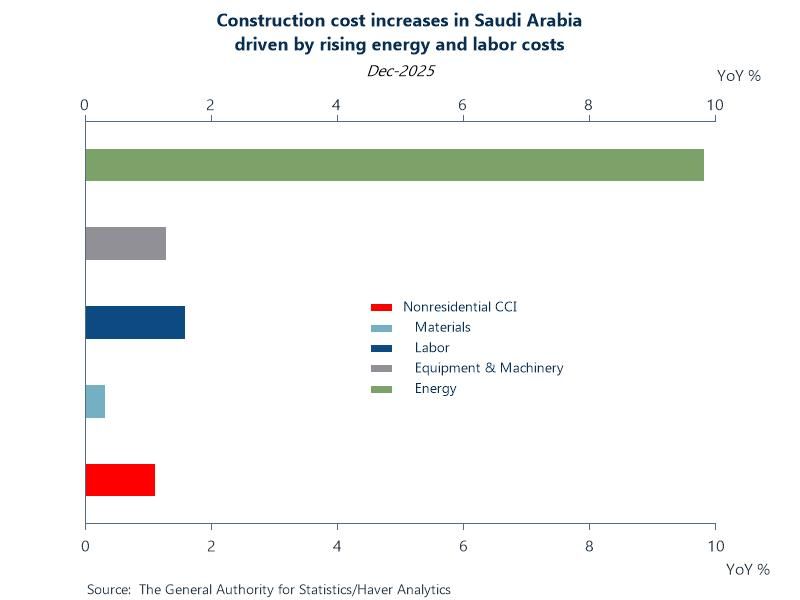
Construction cost indexes for Saudi Arabia were added to the EMERGEMA database. Series include a total with breakouts for the residential and nonresidential sectors. Detail for each sector includes costs for materials, labor, equipment & machinery, and energy. Monthly series are sourced from The General Authority for Statistics and start in June 2024.
Chart: Construction costs in Saudi Arabia have been steadily on the rise since July 2024 as the kingdom presses ahead with large-scale development projects tied to its economic diversification agenda. In the latest December reading, the total, residential and nonresidential indexes all increased by 1.1% YoY. In the nonresidential sector, the increase is attributed to a 1.5% rise in labor costs, a 1.3% increase in equipment and machinery rental prices, and a 9.9% increase in energy prices.
More Featured Data Additions
 Global| Jun 26 2026
Featured Data Additions, June 26, 2026
 Global| Jun 17 2026
Featured Data Additions, June 17, 2026
 Global| Jun 12 2026
Featured Data Additions, June 12, 2026
 Global| Jun 03 2026