 Global| Feb 12 2026
Featured Data Additions, February 12, 2026
CRYPTO → Decentralized Finance → Blockchain Distribution
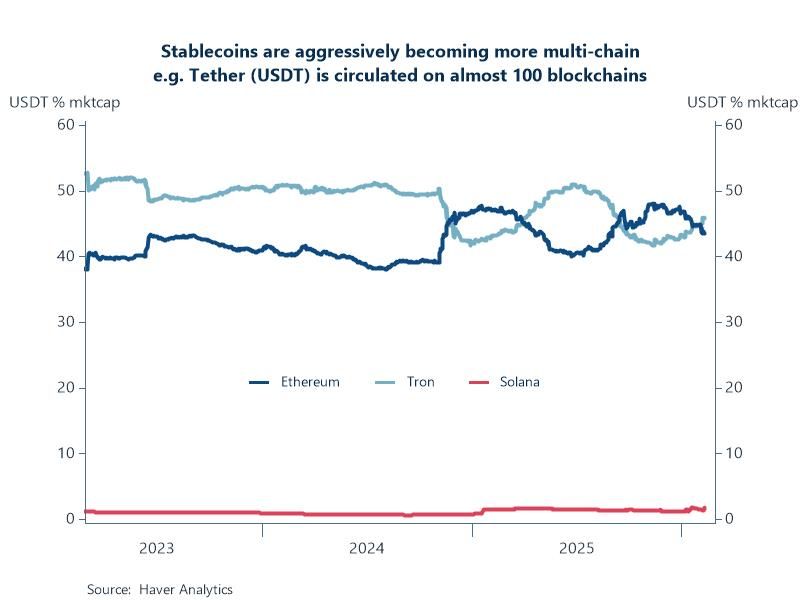
Stablecoin circulation by blockchain statistics were added to CRYPTO. Two hundred and fifty-four stablecoins are tracked across 158 blockchains giving you insights into the layout of the stablecoin ecosystem. These daily data are sourced from DeFiLlama and start as early as November 2017.
Chart: Stablecoins circulate on multiple blockchains to enhance liquidity, increase utility across diverse decentralized applications, and to provide users with transaction speed and cost flexibility. $185 billion of USDT is circulating across 100 blockchains - 90% on Ethereum, Tron, and Solana. Ethereum acts as the primary network for institutional, high-value, and decentralized finance interactions. Tron is widely used for its cost-effective, high-volume transactions. Solana has emerged as a leading chain due to its high speed and low-cost transaction capabilities for everyday commerce.
REGIONW → Economic Conditions Index
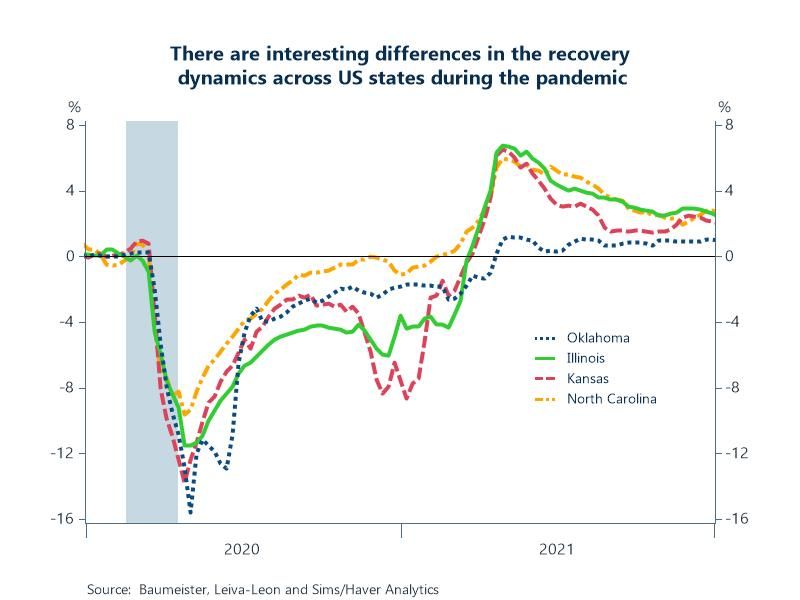
Economic conditions indexes by state were added to the REGIONW database. These series are computed with mixed-frequency dynamic factor models with weekly, monthly, and quarterly variables that cover multiple dimensions of state economies. A value of zero indicates national long-run growth. These weekly data are reported by Baumeister, Leiva-León and Sims and start in April 1987.
Chart: After bottoming out in April 2020, most states started a path to recovery, but with varying speed. Oklahoma experienced a double-dip recession in Q2 2020, but quickly rebounded. In contrast, Kansas gradually recovered until Oct 2020, but then made a U-turn, with economic conditions reaching a low of 8% below national average growth in Jan 2021, which was the lowest across the 50 states. A similar pattern is observed for Illinois, but less stark. North Carolina was already back at trend level growth in Sep 2020, while most states were still on their way to closing the gap.
USECON → Employment and Earnings → Paychex Small Business Employment Watch
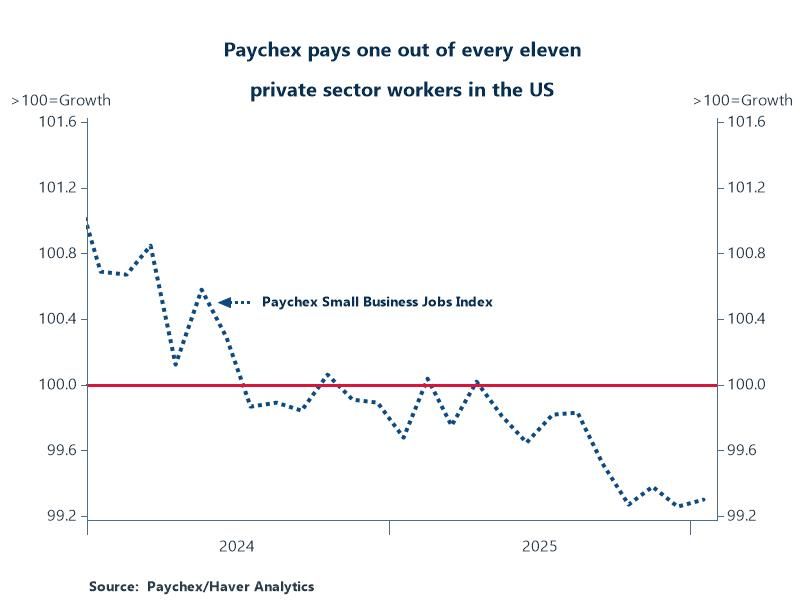
Series from the Paychex Small Business Employment Watch were added to the USECON database. A jobs index, in addition to earnings and hours worked series are included. Paychex developed this empirically driven jobs index of the small business labor market in the US utilizing readily available, aggregated payroll information from a subset of approximately 350k Paychex clients. It provides a monthly measure of change in small business employment among firms with fewer than 50 employees. Data start in 2014.
Chart: The pace of small business employment growth remained relatively unchanged to begin 2026. The national jobs index was up 0.04 pps from last month but slowed by 0.38 pps from last year, dipping from 99.68 in January 2025 to 99.30 in January 2026. We have seen a downward trend and consistent job loss since May 2025, which points to a slowing job market.
ENERGY → Country-Sourced Statistics → Argentina → Electricity Demand
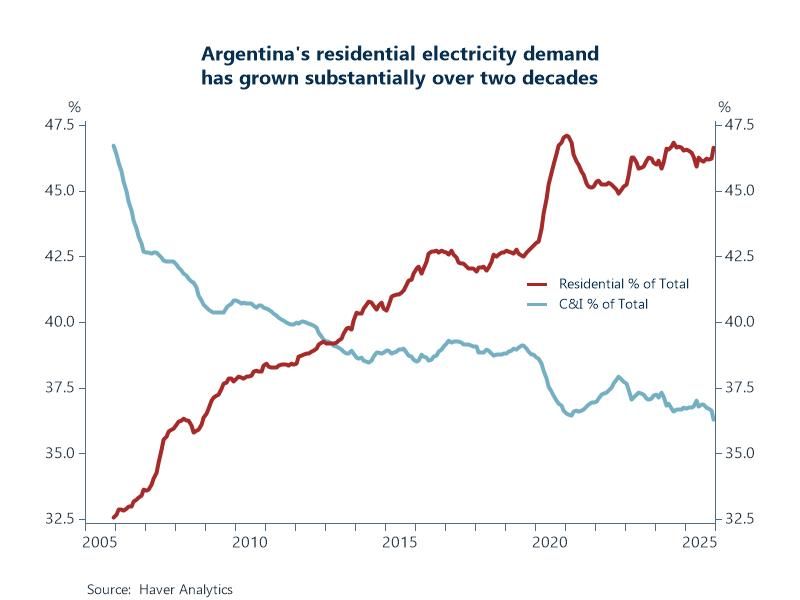
Electricity demand statistics for Argentina were added to the ENERGY database. Series include a national total along with detail for residential, commercial & industrial, and large users. The table also includes a peak demand series. These monthly data are sourced from Ministerio de Economía y Producción and start in January 2005.
Chart: Argentina's residential electricity demand has undergone a significant transformation in the last 20 years. In 2005, residential demand accounted for 32.5% of total demand, while industry led with 46.7%. The residential sector is now the largest consumer of electricity, representing 46.6% of total demand, surpassing industry which currently sits at 36.3%. The sector’s demand has grown primarily due to government energy subsidies, post-2002 economic recovery, population growth, and increased appliance use for climate control due to rising temperatures.
More Featured Data Additions
 Global| Jun 26 2026
Featured Data Additions, June 26, 2026
 Global| Jun 17 2026
Featured Data Additions, June 17, 2026
 Global| Jun 12 2026
Featured Data Additions, June 12, 2026
 Global| Jun 03 2026