Haver Analytics
Haver Analytics

Featured Data Additions: January 2026

  • EIULIVE → EIU Global Liveability Index

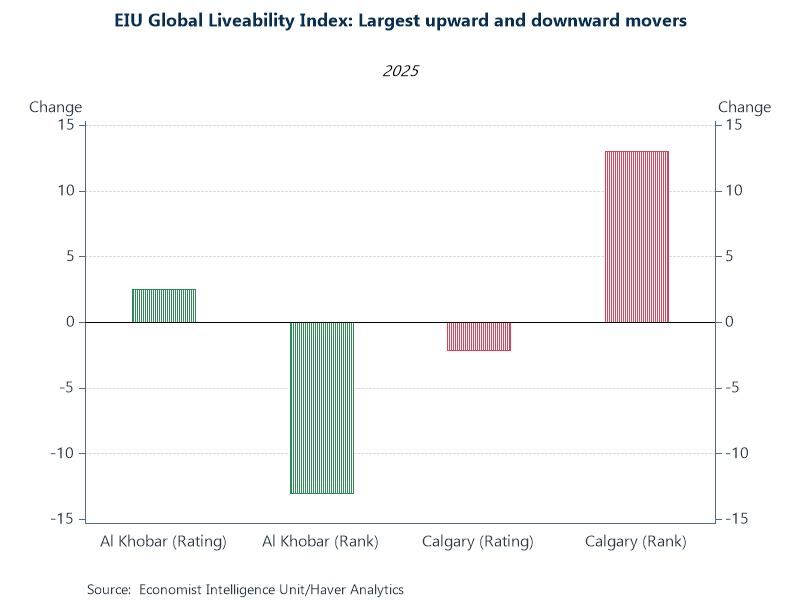
    A new database (EIULIVE) containing EIU’s Global Liveability Index was added to the Haver offering. These data assess which cities around the world offer the best and worst living conditions. 173 cities are assigned a score for over 30 qualitative and quantitative factors across 5 broad categories: stability, healthcare, culture & environment, education and infrastructure. The scores are then compiled and weighted to derive category ratings. An overall rank is also available. These annual data start in 2009.

    Chart: Al Khobar saw the biggest improvement since last year with its overall rating increasing by 2.5 in 2025 improving its overall rank by 13 (#135 overall). Saudi Arabia is investing heavily in improving access to healthcare and education under their Vision 2030 program. Calgary was ranked #5 overall in 2024 and saw a 2.1 point decrease in its overall rating in 2025 causing its rank to plummet by 13 places which now sits at #18. Strains in the country’s national health service intensified lowering Calgary’s healthcare score.

  • ANZR/ANZ → Public Finance → Early Childhood Education: Child Care Subsidy (CCS)

    Child care subsidy (CCS) statistics for Australia were added to the ANZ and ANZR databases. Series include number of children using approved child care, number of families, number of approved services, and the estimated CCS in Australian dollars. These data are available by state and territory. Quarterly data are sourced from the Department of Education and start in Q4 2012.

    Chart: 1,451,860 children from 1,020,930 families were allocated a Customer Reference Number (CRN) by Services Australia in Q3 2025, down 0.13% from Q3 2024. New South Wales had the largest share of children attending approved care, at 31.7% or 460,610 children. Victoria had the largest proportional YoY increase, at 1.03% or 3,700 children.

  • SURVEYS → Federal Reserve Surveys and Indicators → FRB Chicago → Labor Market Indicators

    The Labor Market Indicators data set introduced in September 2025 by the Federal Reserve Bank of Chicago were added to the SURVEYS and USECON databases. These data, updated twice monthly, are designed to provide a more frequent and predictive look at national employment trends. Forecast data include a layoffs and other separations rate, the hiring rate for unemployed workers, and the unemployment rate.

    Chart: These December data were released prior to December BLS Employment Situation. At the time, the relative odds of a decrease in the unemployment rate, as predicted by this model, was 47% - with a 28% chance of no change – and 25% odds of an increase. Of the decreases, there was a 26.3% chance of a 0.1% decrease. The official unemployment rate released on January 9th decreased from 4.5% to 4.4%.

  • BENELUXNetherlands → Financial → Money, Banking and Credit → Modified Duration of Pension Funds

    Modified duration of pension funds statistics for the Netherlands was added to the BENELUX database. Modified duration represents the average time until liabilities are paid, expressed in years, showing how sensitive the fund's total liability value is to a 1% change in interest rates. Detail is available for company pension funds, industry-wide, and other pension funds. These quarterly data are sourced from the Netherlands Central Bank and starts in Q1 2007.

    Chart: The modified duration of Dutch pension funds is expected to decrease significantly as they transition from a Defined Benefit to a Defined Contribution system. This shift will cause them to reduce their demand for long-dated bonds. The first major installment is expected on January 1st, when approximately 550 billion euros in assets will be transferred. As a result, yields on 30-year Dutch and German government bond yields have risen to levels not seen since 2011.